
Tableau Tips and Tricks
Today we’ll be learning some tips and tricks in Tableau to make out analysis faster. This we’ll be very helpful to increase your efficiency while working with large amount of data and tight deadline.
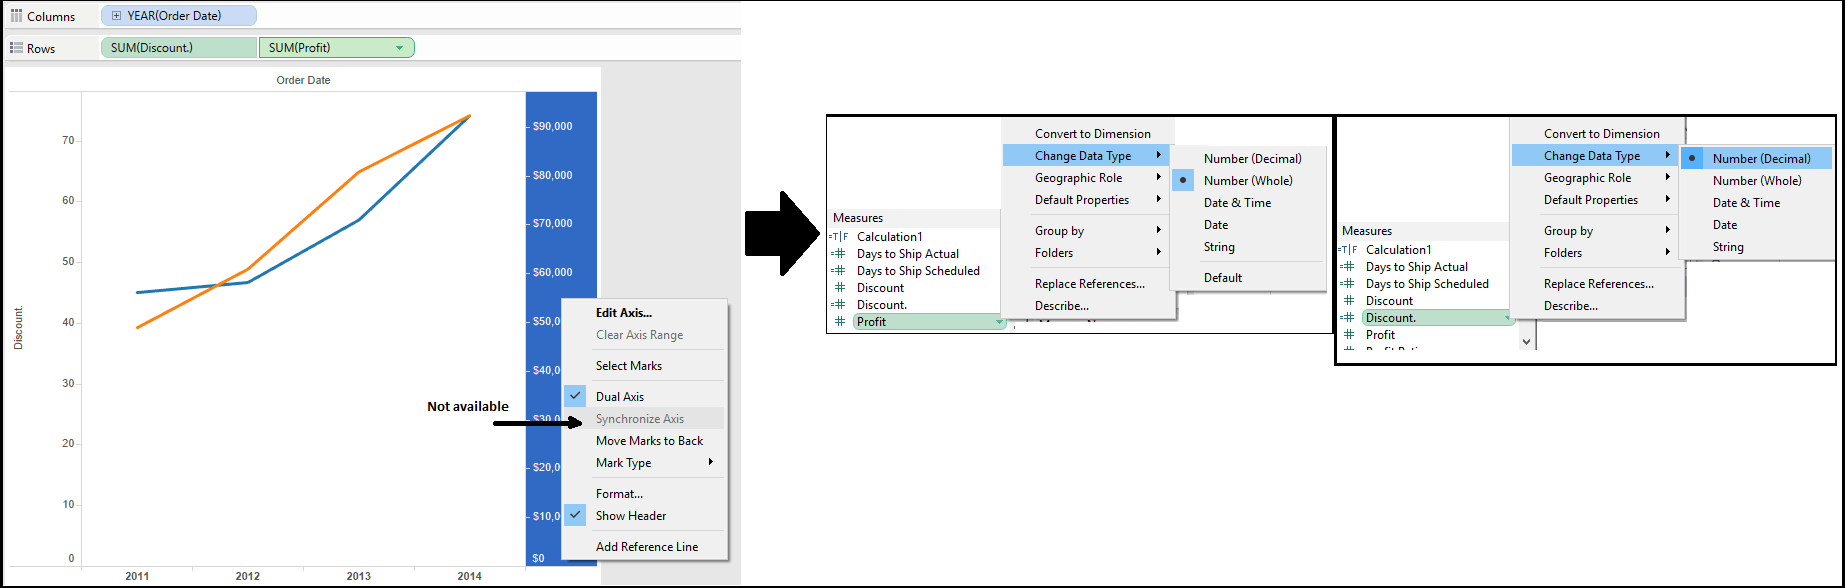
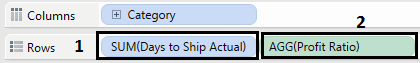
1. Sometimes while making dual axis chart that Synchronize Axis option is not available. The reason behind this is the difference between data types as we can see in the image below. Make the data type same than the synchronize axis will work.
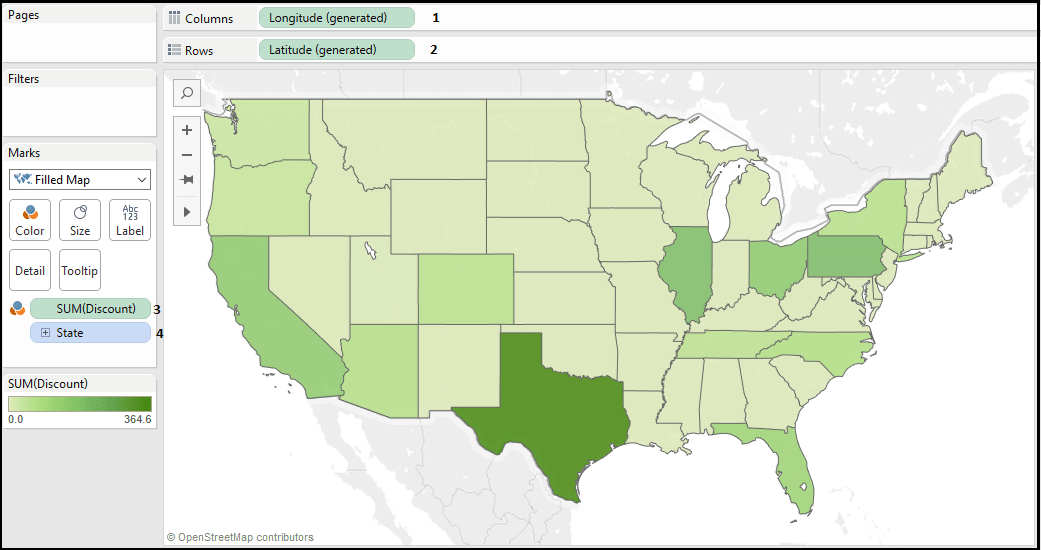
2. To quickly create map put longitude in columns shelf and latitude in rows shelf and put state,city or the dimension which you have in details card. And that’s done.
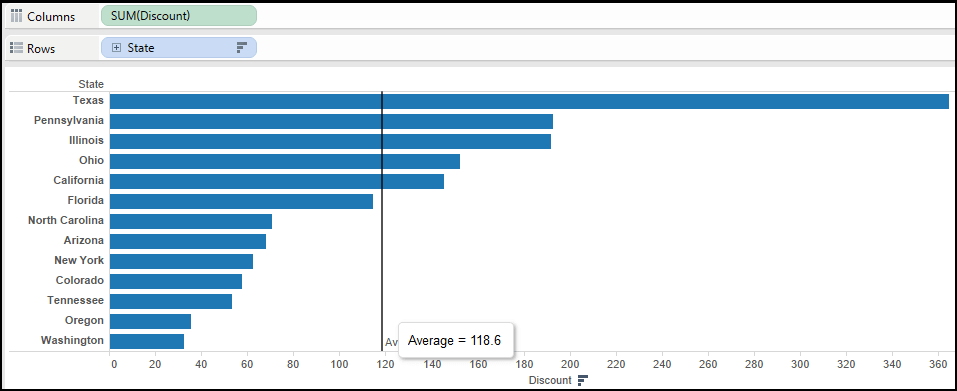
3. To calculate Average of any measure just put the average line from analytics pane in the chart and to remove the average line drag it off the chart.
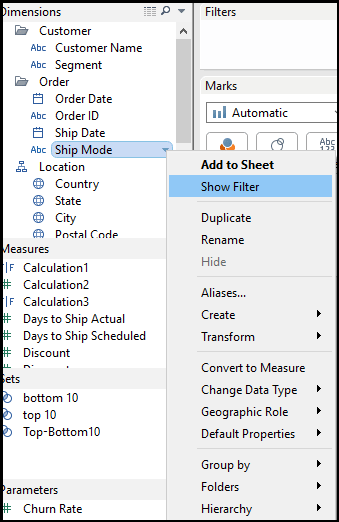
4. To apply the quick filter just right click on the measure and select show filter.
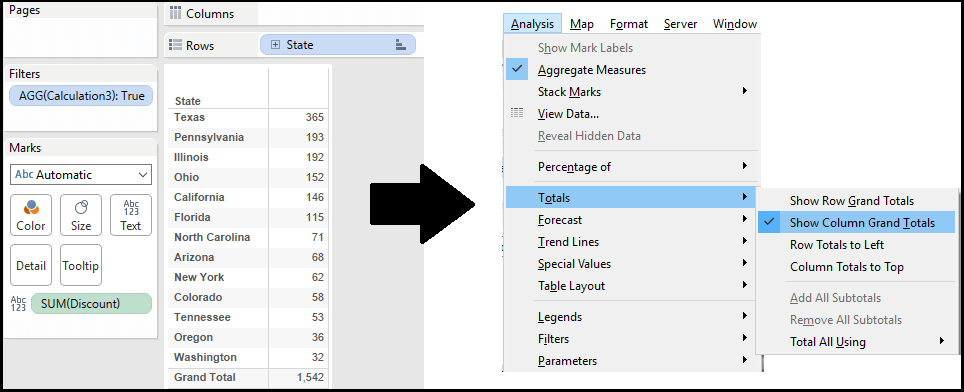
5. To show the grand total in Table go to Analysis>Totals>Show Column Grand Totals.
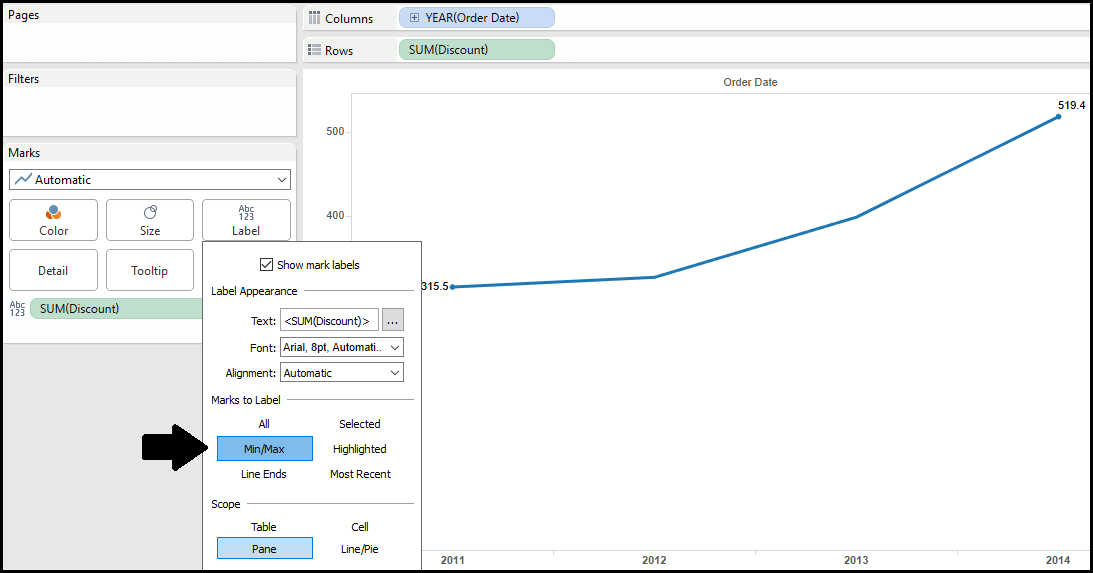
6. To show the fist and last label and if the max is at the end select Min/Max from edit label option. If the last is not max then select other labels and delete it.
7. To make the drill down dashboard with the maximum space utilized. Add a container to the dashboard and put two worksheets in the same container. Now go to Dashboard>Action. Now select Add Action filter. Select the source sheet and Target Sheet. Run action on as SELECT and Exclude all values option in clearing the selection will. Click Ok and that’s done. 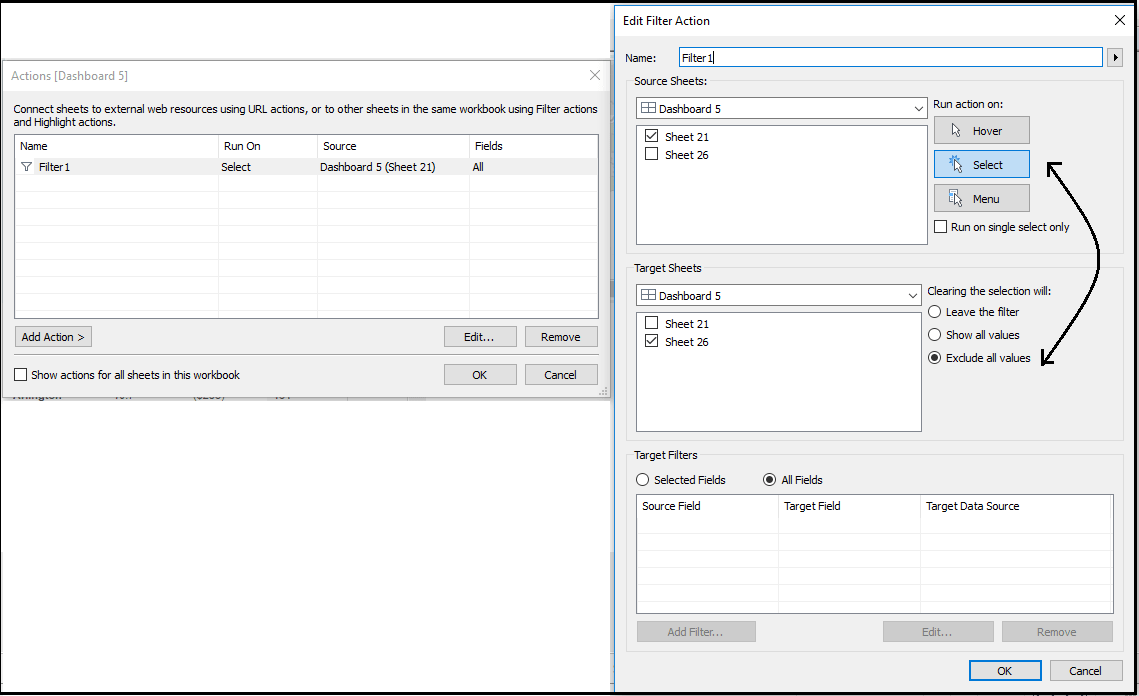
8. Replace NULL values with any value
– IFNULL(ColumnName,Value to replace with)- IFNULL function can be used to replace null values with any value. for example: IFNULL([Abc],3): all the null values in Abc column will be replaced by 3.
– ZN(ColumnName)- ZN will replace null values with 0. for example: ZN([Abc]): all the null values in Abc column will be replaced by 0.
9. Choosing Chart Type, this is very handy infographic to select chart type for the visualization. Which chart or graph is right for you? is published by Tableau also very useful.
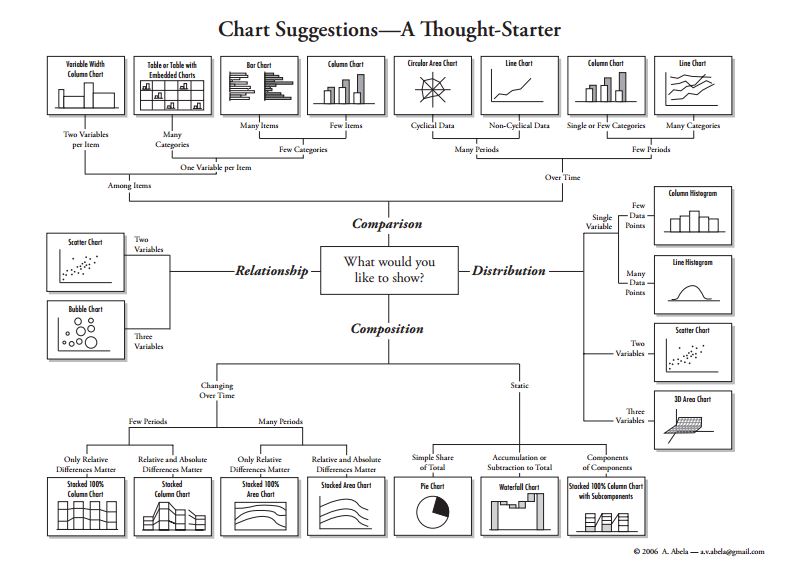
Image Source and PDF
10. Different Tableau files
Workbooks (.twb) – Tableau workbook files have the .twb file extension. Workbooks hold one or more worksheets, plus zero or more dashboards and stories.
Bookmarks (.tbm) – Tableau bookmark files have the .tbm file extension. Bookmarks contain a single worksheet and are an easy way to quickly share your work. For more information, see Bookmarks.
Packaged Workbooks (.twbx) – Tableau packaged workbooks have the .twbx file extension. A packaged workbook is a single zip file that contains a workbook along with any supporting local file data and background images. This format is the best way to package your work for sharing with others who don’t have access to the original data. For more information, see Packaged Workbooks.
Data Extract (.tde) – Tableau data extract files have the .tde file extension. Extract files are a local copy of a subset or entire data that you can use to share data, work offline, and improve database performance.
Data Source (.tds) – Tableau data source files have the .tds file extension. Data source files are shortcuts for quickly connecting to the original data that you use often. Data source files do not contain the actual data but rather the information necessary to connect to the actual data as well as any modifications you’ve made on top of the actual data such as changing default properties, creating calculated fields, adding groups, and so on. For more information, see Export Data Sources.
Packaged Data Source (.tdsx) – Tableau packaged data source files have the .tdsx file extension. A packaged data source is a zip file that contains the data source file (.tds) described above as well as any local file data such as Extract files (.tde), text files, Excel files, Access files, and local cube files. Use this format to create a single file that you can then share with others who may not have access to the original data stored locally on your computer. For more information, see Export Data Sources.
11. Alias doesn’t work in Calculated fields, aliases are only for visual purpose only.
12. Maximum 32 tables can be joined with limit of 255 columns in Tableau, after that it will throw an error Database error 0x800004005: Too many fields defined.
13. Green v/s Blue
1. Blue data fields are discrete
2. Green data fields are continuous
14. Groups and Sets
Groups: Combining members of dimension and creating a higher level members like bins (Now groups can also be used in calculation field from Tableau 10).
Sets: A subset of data which depends on some conditions based on dimension.
15. Rounding Off
For rounding odd we have inbuilt function in Tableau CEILING and FLOOR.
CEILING– Rounds a number to the nearest integer of equal or greater value, CEILING(3.9) will return 4.
FLOOR– Rounds a number to the nearest integer of equal or lesser value, FLOOR(3.9) will return 3.
16. Concatenate
For Concatenation there is no direct function as we have in MS Excel and it can be achieved with the following technique.
For Dimensions
[Order ID] + “-” + [State] will return ID1-Karnataka
For Measures
STR(Profit)+ “-” + STR(Discount) will return 40-100
Dimension and Measure combined
[State]+ “-” +STR(Profit) will return Karnataka-40
So these were some useful tips to increase our work faster in Tableau. I’ll add more tips and tricks as I came to know few more. Most of them are self observations and few are from different Source, Limits.
Thanks for reading! Keep visiting Analytics Tuts for more tutorials.
Awesome and super Tricks Nikit:)
Thanks Niket for the great Tips and Tricks. I am following you blog since long and helped me get my new Job and enhance my knowledge. The password protected dashboard was so cool. I also want to help you running this very helpful blog. Let me know if you need help.
Thanks for the valuable information!!
Hi Thank you for the Tips in Tableau.
I have a scenario below.
If we have three different sheets and all are having different date parameters. For Example, Hourly, Daily and Monthly.
Hourly Sheet contains Order Date as the date parameter. It will give you the hourly data based on the selected Order Date.
Daily Sheet contains Shipping Start and Shipping End Date as the Date Parameters. It will give you the Daily data based on the selected Shipping Start Date and Shipping End Date.
Monthly Sheet contains Order Start and Order End Date as the Date Parameters. It will give you the Monthly data based on the selected Order Start Date and Order End Date.
I have place all the three worksheets in a single dashboard with same layout values. I have created a parameter to display one chart only based on the selected View. (Selected View Contains Hourly, Daily and Monthly Views. Its a Parameter).
Now if I select Hourly, I should see only Order Date in the Dashboard instead of all the Date Parameters.
Similarly if I select Daily, I should see only Shipping Start Date and Shipping End Dates in the View.
If I select Monthly, I should see only Order Start Date and Order End Dates in the View.
How can we achieve this.
When you are about to run your extract, you have an option to aggregate your data. If it makes sense for your situation then check the box and this will reduce your row count significantly. For example, if your data is daily, but you are only going to be looking at monthly values then go ahead and aggregate your data up to the month. This will reduce your row count by a lot and help with performance.