
Earth’s Orbital Movement in Tableau
In my last post I visualized the earth movement around the sun. Now we will see Step by step tutorial to create the same visualization.
1. Creating the Data
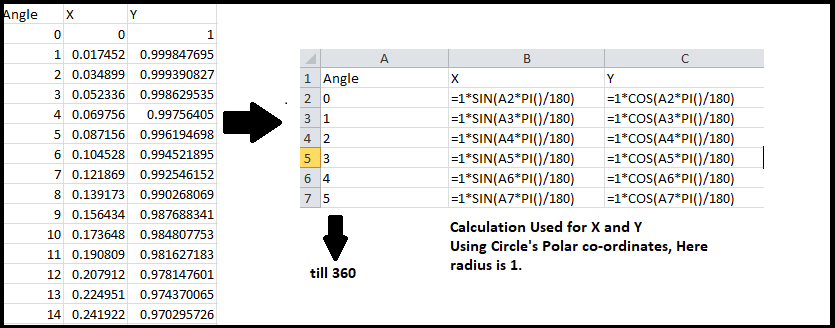
I’ll be using Circle’s polar co-ordinates to get X and Y axis values (you can use Cartesian co-ordinates also)
X – r*sin(t), Y – r*cos(t) where r is radius of the circle. Check out here to read more about Polar co-ordinates. See image below for reference.
2. Creating the Earth visualization sheet
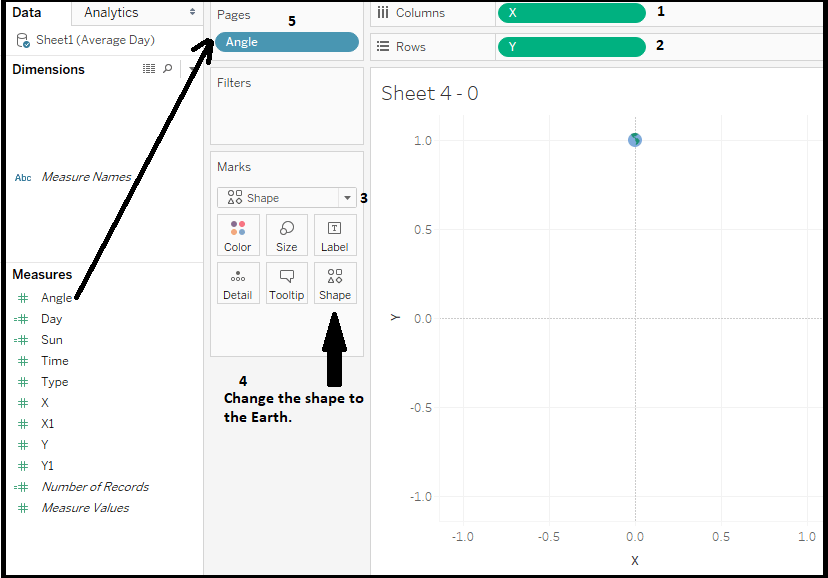
2.1 Put measure X in columns shelf and measure Y in rows shelf.
2.2 Change the default chart to shape and change the shape to custom shape and make it as Earth. Refer Custom Shapes in Tableau for more idea about it.
2.3 Put measure Angle in Pages shelf. Pages shelf is nothing but a filter which runs sequentially one a time. But only works in Tableau Desktop version.
2.4 Format the sheets as required, here I removed all the axes and tick marks and changed the background color to black color.
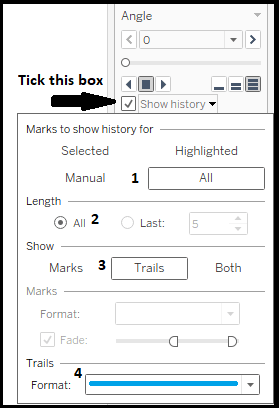
2.5 Now in the right side you can find Page card and make the following changes. Show History, Show history for All the data, Length: All, Show: Trails, Trails format: Blue in color. You can test the sheet(Point movement) by clicking on the play button just above the show history option.
3. Creating the Seasons Sheet
3.1 To get the Seasons sheet create a calculated field Named “Season” with the following conditions:
If [Angle] > 270 THEN "Autumn"
ELSEIF [Angle] >180 THEN "Summer"
ELSEIF [Angle] >90 THEN "Spring"
ELSE "Winter"
END
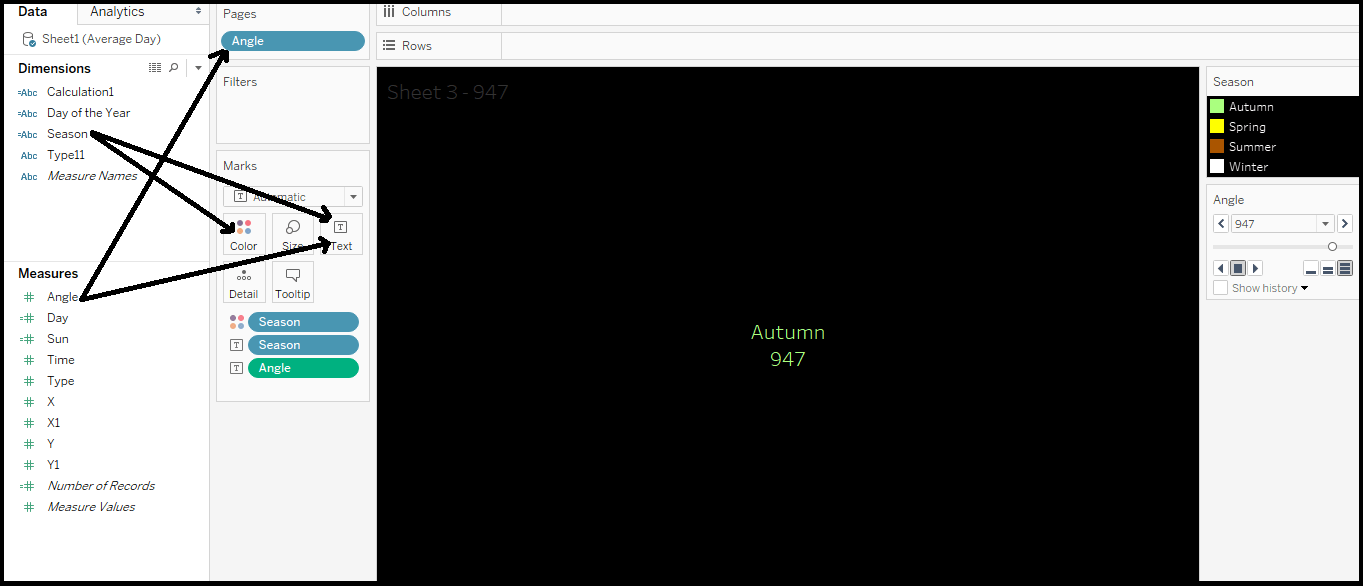
3.2 Create another sheet for seasons as shown below. Season Calculated field into Color and Text, and Angle to Text and Pages shelf and done.
4. Creating the final dashboard
– First take a rectangular dashboard here I’ve chosen width: 1200px and height: 800px so that the circle looks like ellipse because earth’s orbit is elliptical.
– Now add both the sheet to the dashboard as shown below.
– Add an image of the sun in the dashboard and place it towards the left side of the dashboard as shown below
This was about using page shelf in Tableau. But Pages shelf works only in Tableau Desktop version not in Public, Online or server.
Note: I skipped explaining few things like Custom shapes, formatting the sheets here because I’ve already done that in my previous tutorials. Check out those for get more idea.
Thanks for reading! Comment your queries and suggestions!
Keep visiting Analytics Tuts for more tutorials!
Are you sure that motion chart will work after publishing
Hi Praveen,
Page shelf is not working for Tableau Online/Public/Server as of now so motion chart will not work for after publishing online.
I’m still looking some ways to make it work online! Keep checking Analytics Tuts for more tutorials and further updates on this!