
Yearly/Quarterly/Monthly viz in Single chart in Tableau
Today we’ll be learning to create Yearly/Monthly/Quarterly viz in single chart and the use of DATENAME() function in Tableau. I’ll be using Superstore data for the tutorial.
Creating Parameter
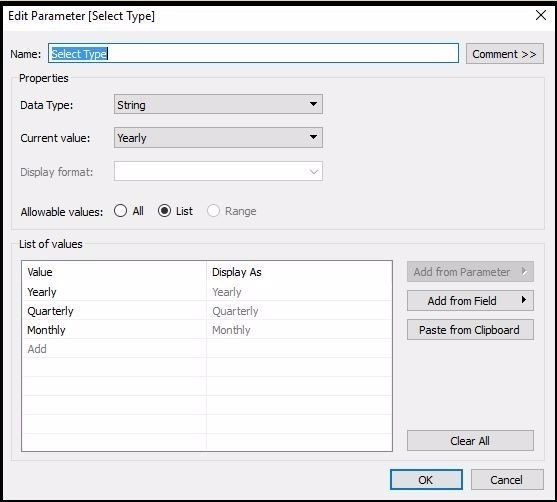
For the first step we’ll be creating Parameter for the drop down list. Create a parameter and Insert the values as required. Here I am adding Yearly, Quarterly and Monthly as drop down list. You can add as many values as you want. See the below image for reference.
Creating Calculated field
In this step we’ll be creating calculated field. Here I have used Ship date dimension for the viz.
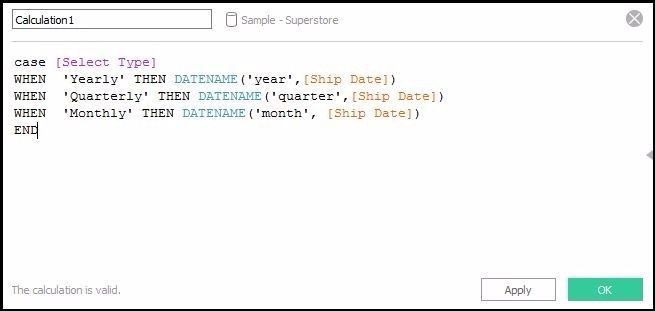
Here is the calculated field we’ll be using.
CASE [Select Type]
WHEN 'Yearly' THEN DATENAME('year',[Ship Date])
WHEN 'Quarterly' THEN DATENAME('quarter',[Ship Date])
WHEN 'Monthly' THEN DATENAME('month', [Ship Date])
END
As you can see we have used DATENAME function. so the working of DATENAME is as follows:
DATENAME(date_part, date, [start_of_week])
Returns date_part of date as a string. The start_of_week parameter is optional.
If it is omitted, the start of week is determined by the data source.
Examples:
DATENAME('year', #2004-04-15#) = "2004"
DATENAME('month', #2004-04-15#) = "April"
DATENAME('quarter', #2004-04-15#) = "2"
Read more here- Date Functions in Tableau
Creating the Final Viz
This is the last step to create the visualization.
Place Calculated field we just created (Calculation 1 in this case) to column shelf, Discount to Rows shelf, Ship date to filter. Right click on the parameter we just created(Select Type) an click on show parameter.
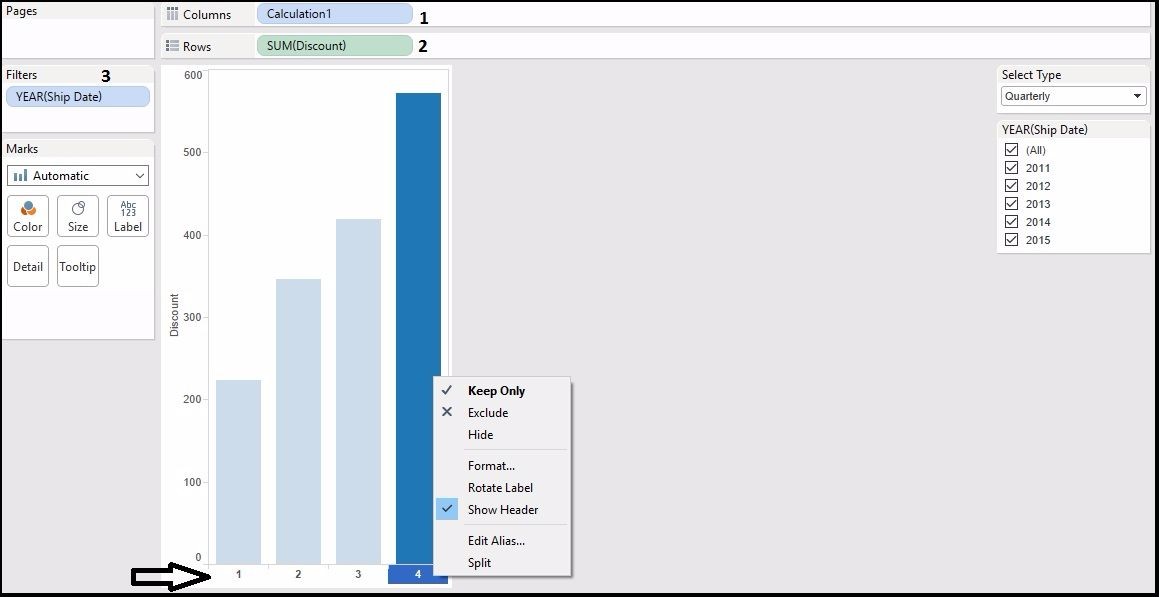
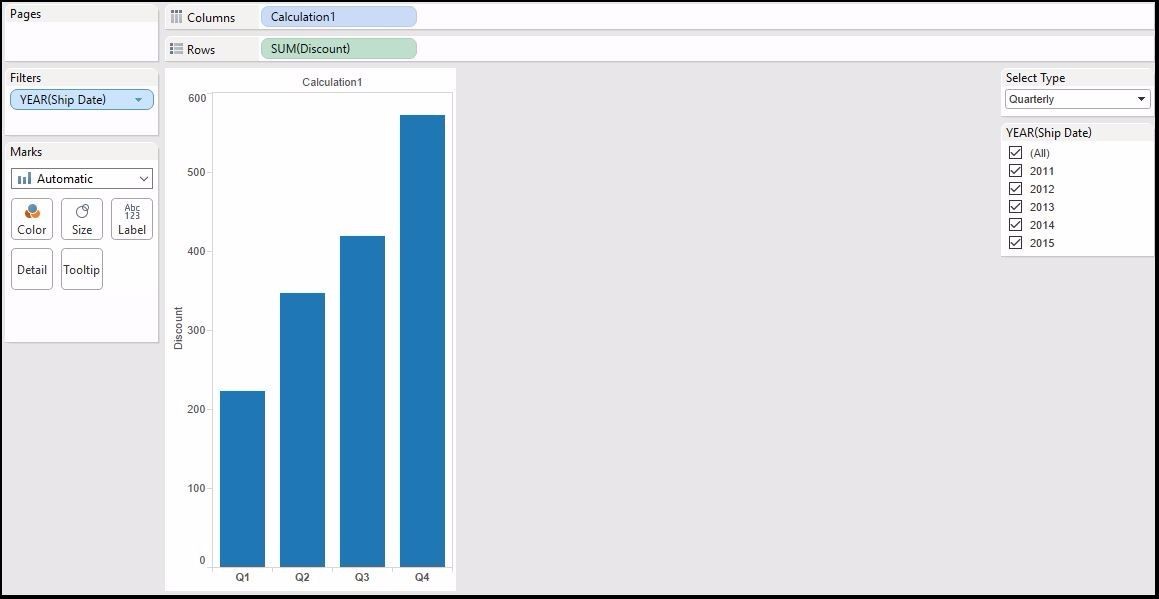
Now you’ll notice everything is working fine except the quarterly label (the arrow mark). Actually the DATENAME function returns Quarter 1(Q1) as 1,Quarter 2(Q2) as 2 and show on. Right click on the label and click ‘Edit Alias’ and change 1 to Q1, 2 to Q2, 3 to Q3 and 4 to Q4 and that’s done. As you can see in the below image that now it is working as we require.
So this was very simple and effective way to create the year over year or month over month viz in single chart in Tableau
Love this and use it frequently to toggle! Best part is it works across multiple, unjoined data sources as well.
I had always done this with text fields associated with the date and I love how you’ve accomplished the same using DATENAME
Thanks Kevin, glad you liked it. Please check other tutorials and share with your friends too.
Yes this works superb!! I had used to same logic and created very dynamic chart layout.. Awesome use of parameter!!
Thanks Bhavna, glad you liked it. Please check other tutorials and share with your friends too. There are some more tutorials on the use of parameters.
I just discovered Tuts and I am loving the hints about Tableau. Thanks for sharing your Knowledge. I am so grateful.
While this works great for discrete date measures, would it really work for continuous data display where one would be interested in seeing the trend of data over a given time e.g. over a 12 month time frame in 3 years?