
Curved path label using geomtextpath using in R
Hello friends!! We’ll be learning how to create the curved path label in R using geomtextpath package to make visualization much more attractive. Easy and quick tutorial to follow.
I’ll be using the Pokemon dataset from Kaggle. I’ll be doing density plot using different variables.
Loading package
library(ggplot2)
library(patchwork)
Reading data
df <- read.csv("Pokemon.csv")
Creating Plots
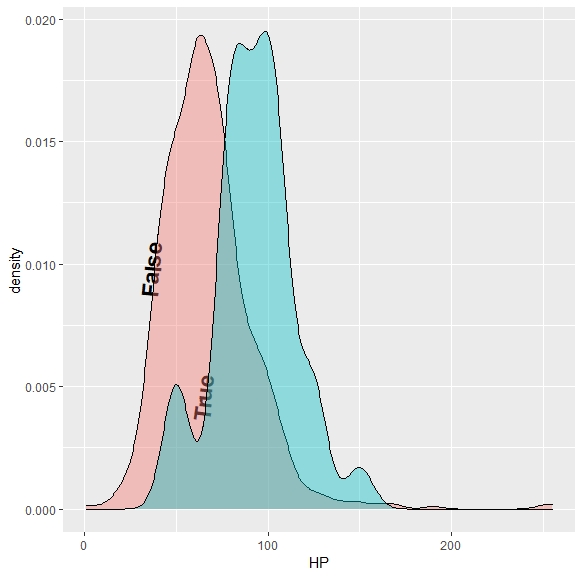
#Plot1--
ggplot(df, aes(x=HP, fill=Legendary, label = Legendary)) +
geom_textdensity(size = 6, fontface = 2, hjust = 0.2, vjust = 0.3) +
geom_density(alpha=0.4) +
theme(legend.position = "none")
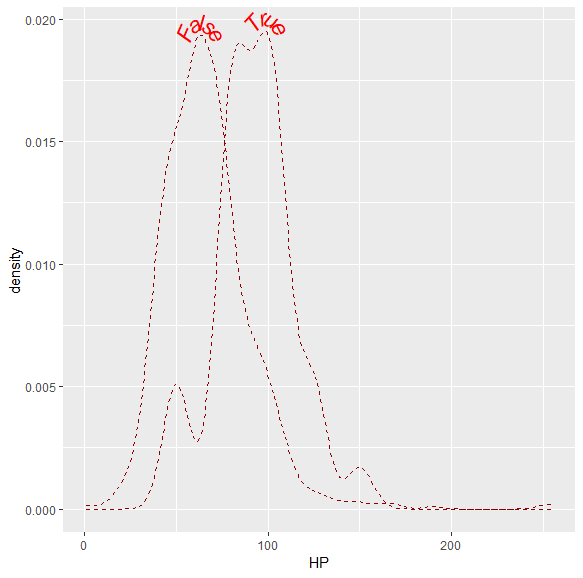
#Plot2----
ggplot(df, aes(x=HP, fill=Legendary, label = Legendary)) +
geom_textdensity(size = 6, fontface = 3, spacing =50,hjust = "ymax", vjust = -0.2,linecolor = "red4", linetype = 2, color = "red") +
theme(legend.position = "none")
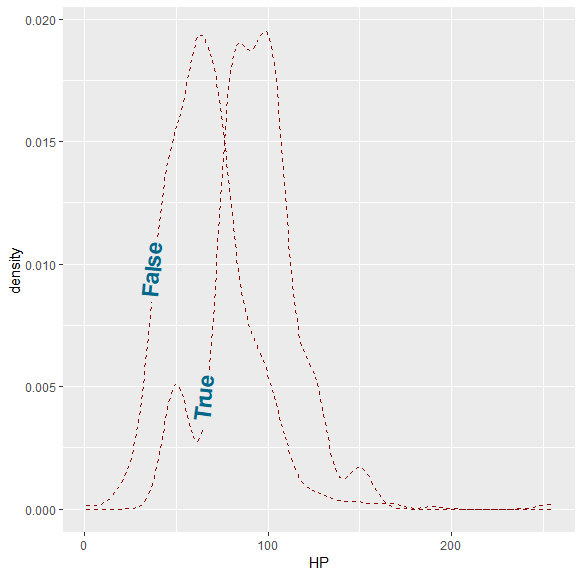
#Plot3----
ggplot(df, aes(x=HP, fill=Legendary, label = Legendary)) +
geom_textdensity(size = 6, fontface = 2, hjust = 0.2, vjust = 0.3, linecolor = "red4", linetype = 2, color = "deepskyblue4") +
theme(legend.position = "none")
Keep visiting Analytics Tuts for more tutorials.
Thanks for reading! Comment your suggestions and queries.