
Dual Axis Chart
Today we’re going to learn about Dual Axis Chart which is a one of the best methods I like. I will try to explain in very easy steps and also you can find the Tableau Workbook at the end of the post.
I will be using sample-store data(available on table desktop as sample data)
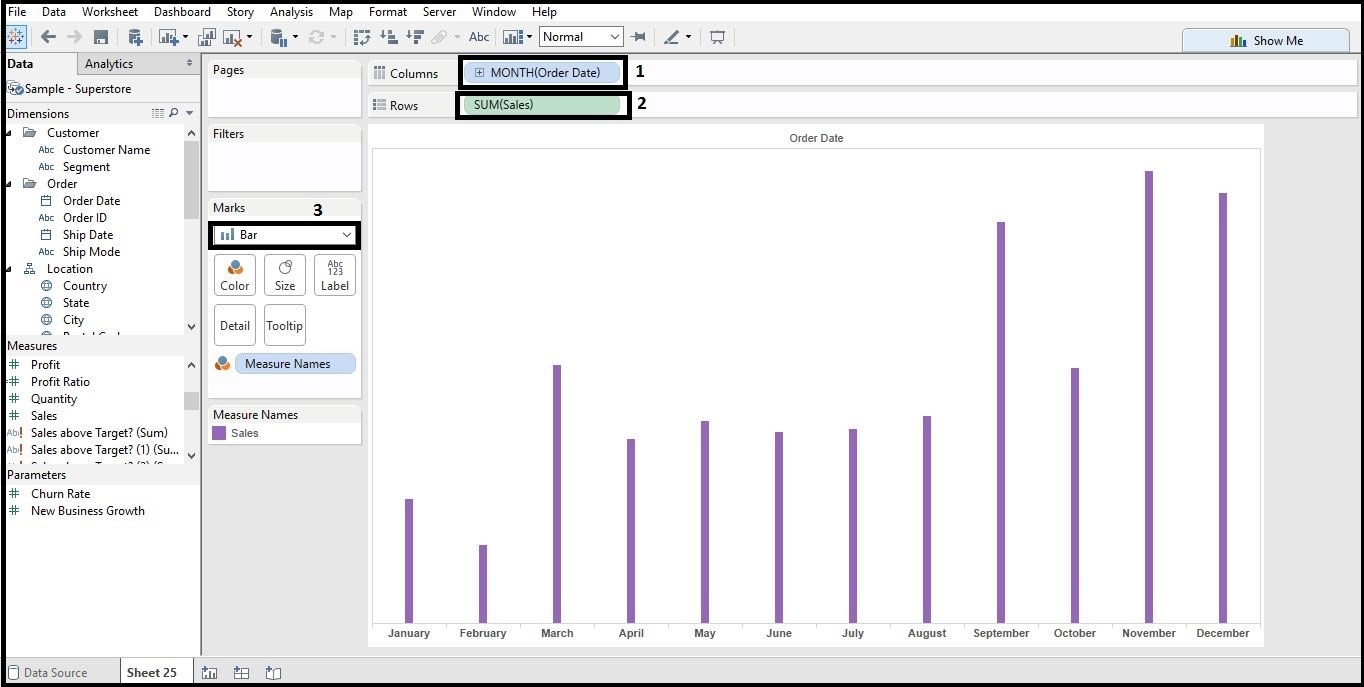
Step 1. First Bar Graph
a. Put the Order date (can be found in Dimensions) into Columns shelf and change it to month.
b. Put the sales in Rows shelf.
c. Now change the chart type to Bar.
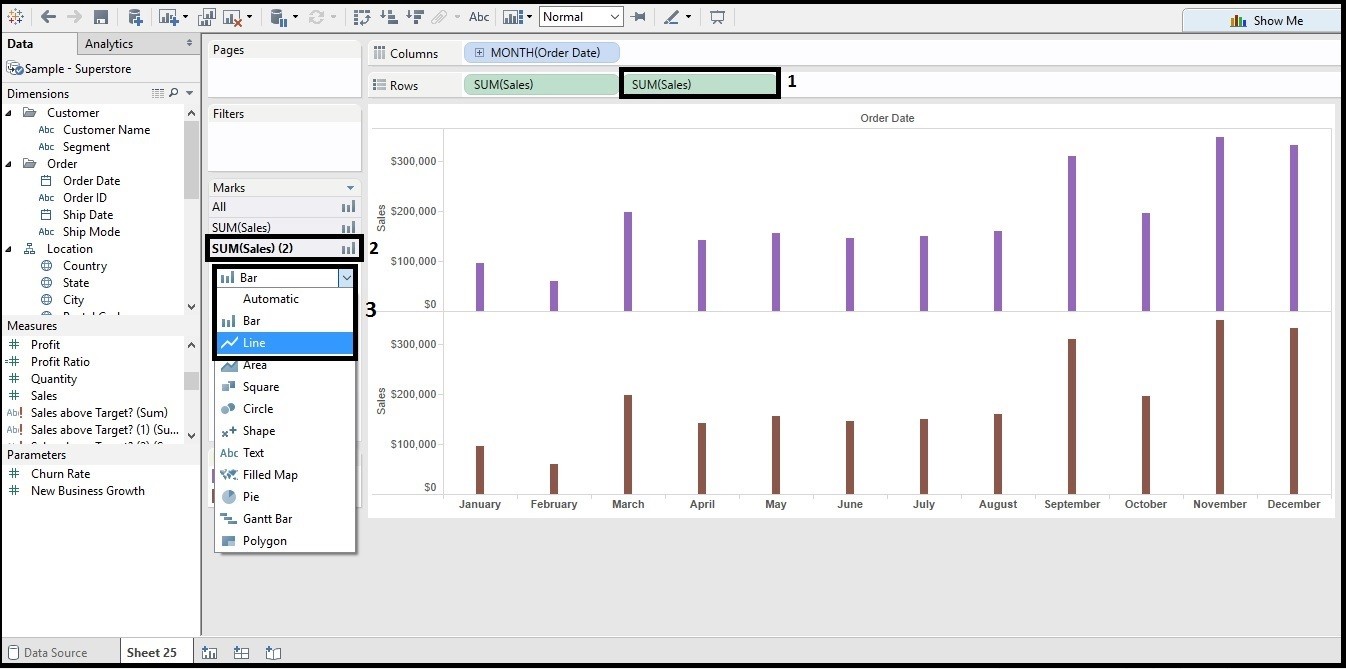
Step 2. Second Chart
a. Put the sales in Rows shelf one more time.
b. Change the chart type to line.
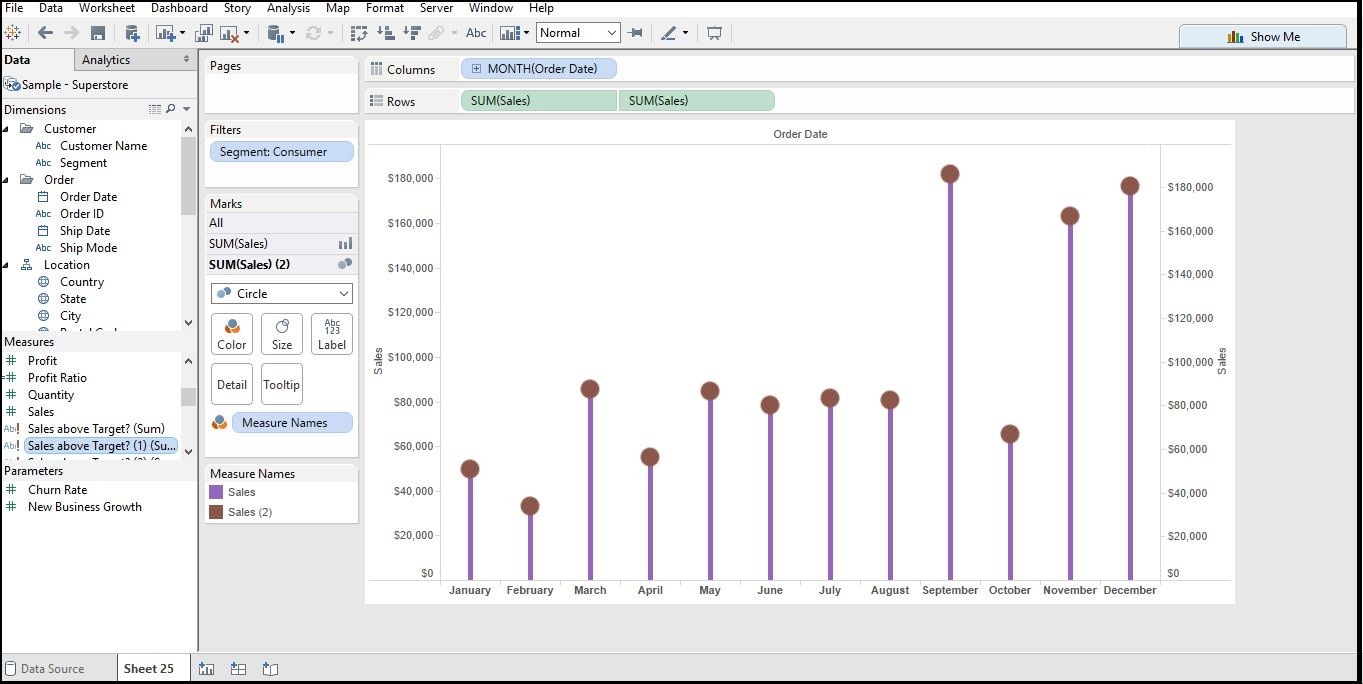
Step 3. Create the Dual axis Chart
Click on the Dual Axis from the drop down menu as shown in the picture.
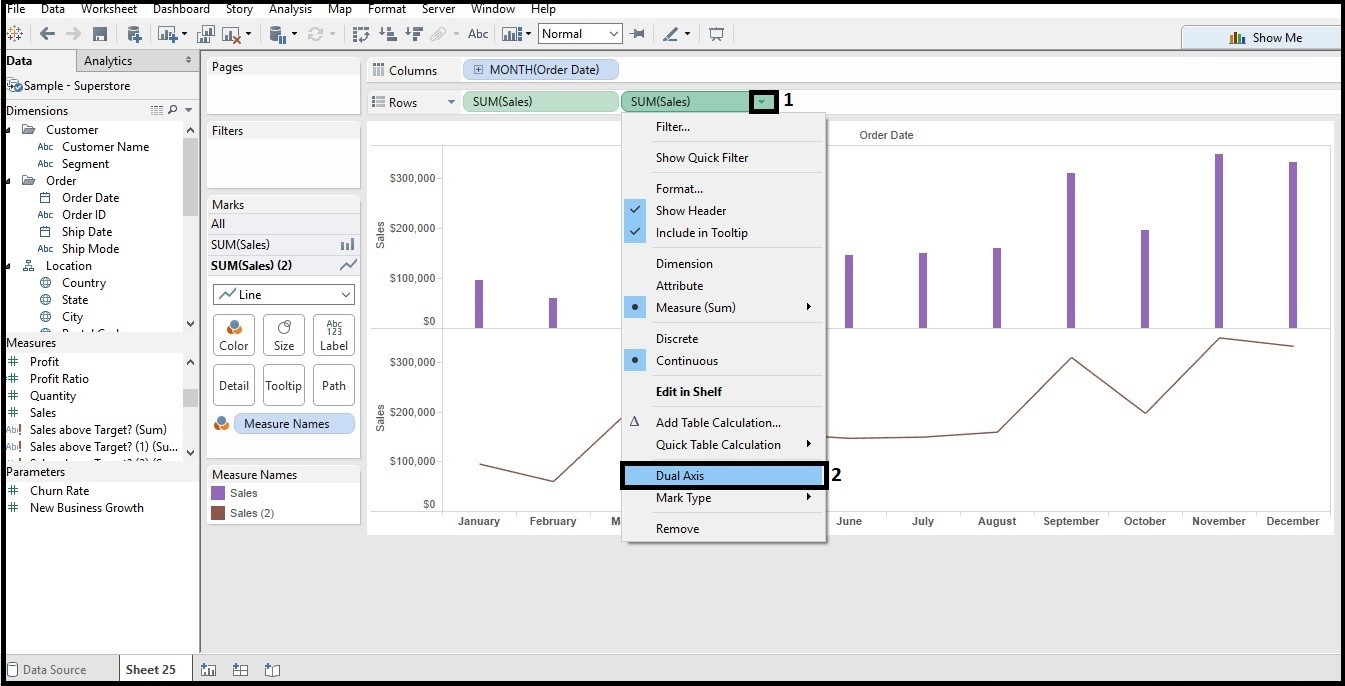
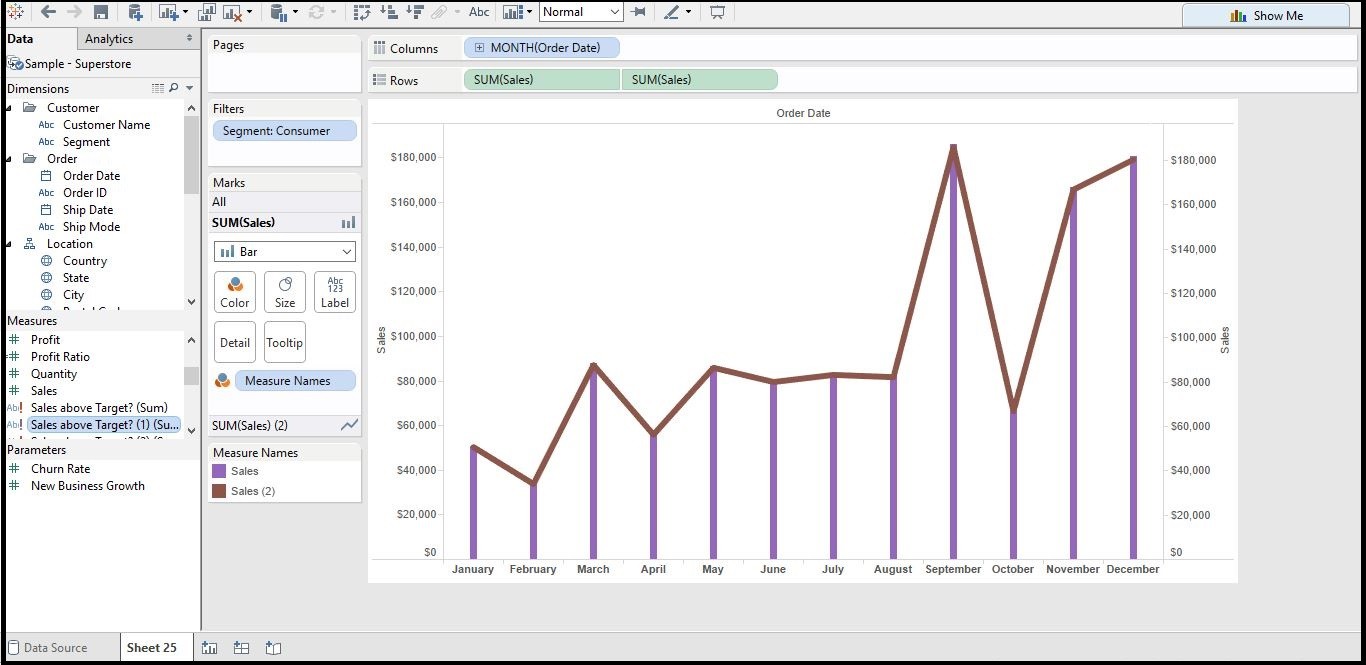
With this done, we’ve completed the dual axis chart.
Change the line chart to circle to get the following chart.
This is my first post and try to keep updating regularly.