
Gantt Chart Project Management excel Template
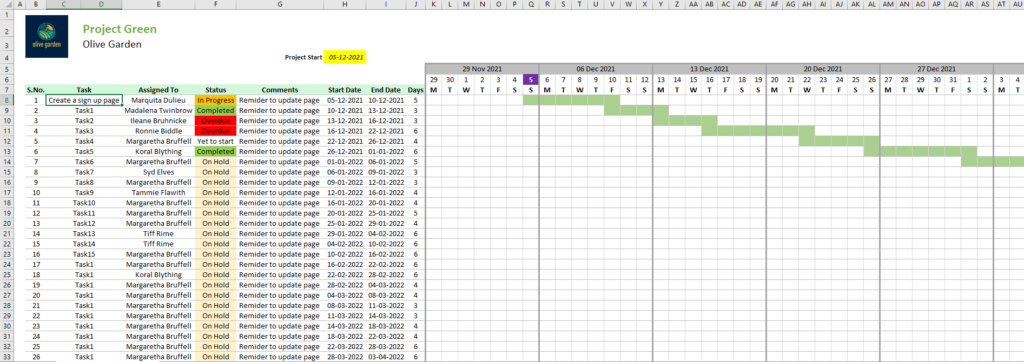
A Gantt chart is a horizontal bar chart used in project management to visually represent a project plan over time. Gantt charts typically show the timeline, status, assigned member for each task in the project.
This Gantt chart template provides an user friendly and easy to use template to create Project management schedule. Template is setup to visually represent all your project tasks in single view.
Use coupon code for discount – edyjzp3
Click here to get the template.
Keep visiting Analytics Tuts for more tutorials.
Thanks for reading! Comment your suggestions and queries