
Get the Sum of Filtered Data in Excel
Hello friends!! We’ll be learning to do calculation and do aggregation on filtered data in Excel. We’ll achieve this using the SUBTOTAL() function in Excel.
Suppose you are working in Excel and you want to show the values of filtered data you can use the use SUBTOTAL function in excel. It has various aggregate functions like SUM, Avg,count, max, min etc.
Let’s say you have data in column A and Column B and you want to show the sum of Sales (column B) and values should change when filter apply on Category (Column A). Sample data as shown in the image below.
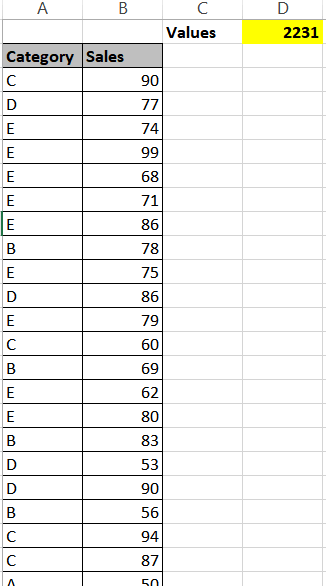
Formula is written in Cell D1 to get the sum of Sales
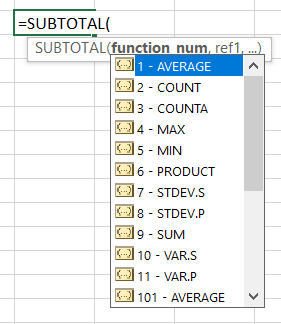
Syntax is - SUBTOTAL(function_num , ref)
here I've used 9 to get the total sales from Column B
=SUBTOTAL(9, $B$1:$B$100)
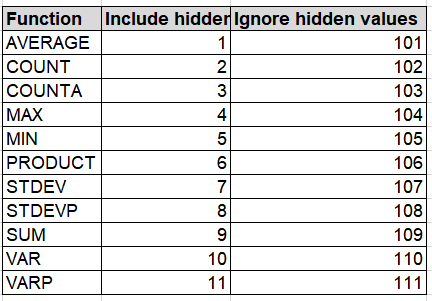
Function number are shown below
So it was about the SUBTOTAL function in Excel. It can be achieved with the AGGREGATE function in Excel but SUBTOTAL is more easy and faster.
Keep visiting Analytics Tuts for more tutorials.
Thanks for reading! Comment your suggestions and queries