
Multiple Measures in single chart in Tableau
Hello friends! Today we’ll be looking at quick Tableau tip to show multiple measure values in chart in easy 3 steps.
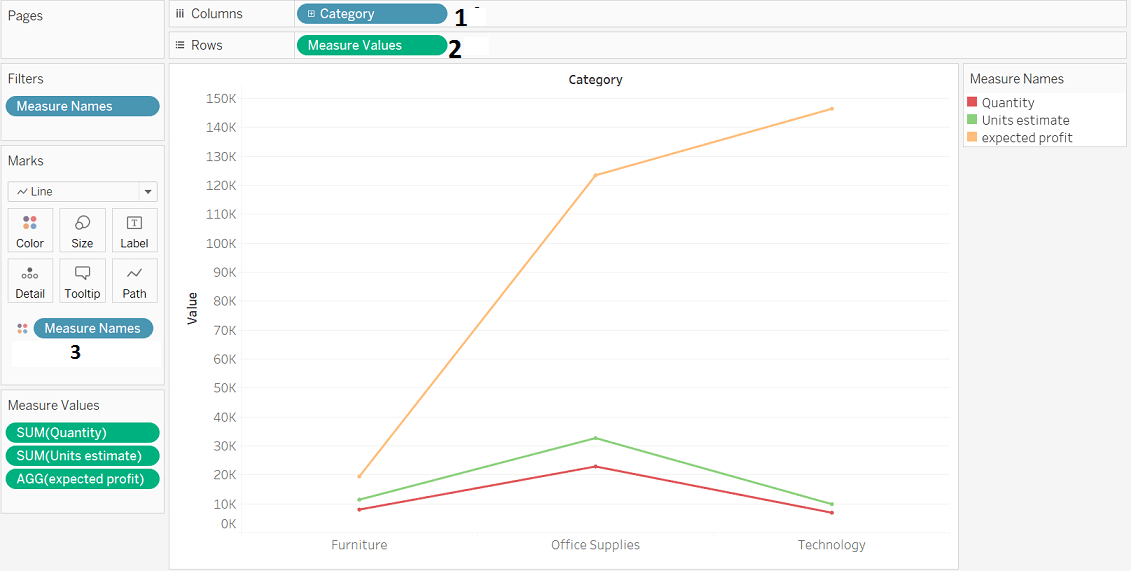
Steps:
1. Add dimesion to column shelf
2. Add measure values to rows shelf
3. Add measure names in color/details in marks card and that’s done (refer image below).
So, that’s pretty quick tip to use multiple measures in single chart with utilizing maximum space and getting meaningful insights.
Comment your queries and suggestions. Share the tutorials with your friends.
Thanks for reading and Keep visiting Analytics Tuts for more tutorials.