
Regional UK map in Tableau
Hello friends today we’ll be learning how to create regional UK map. UK is having more than 2500 post codes but having around 10 regions. Getting an insights is very difficult as you can see in the final image(in the end of the tutorial).
I was working with the UK map for the first time and got to know about it. I’ve a work around to create a higher level regions which is simple but tedious task. I’ve attached the tableau public link to download and reuse the dashboard. Also I’ve provided the postcodes sources in the end of the tutorial.
So, UK is having 11 major regions.
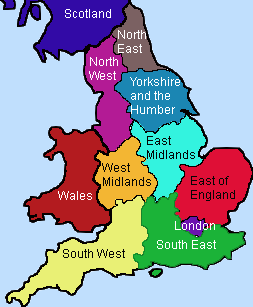
Source: Google images
You can find the Postcode sources in the end of the tutorial. I’m assuming you know how to create groups in Tableau if not please check out group tutorials.
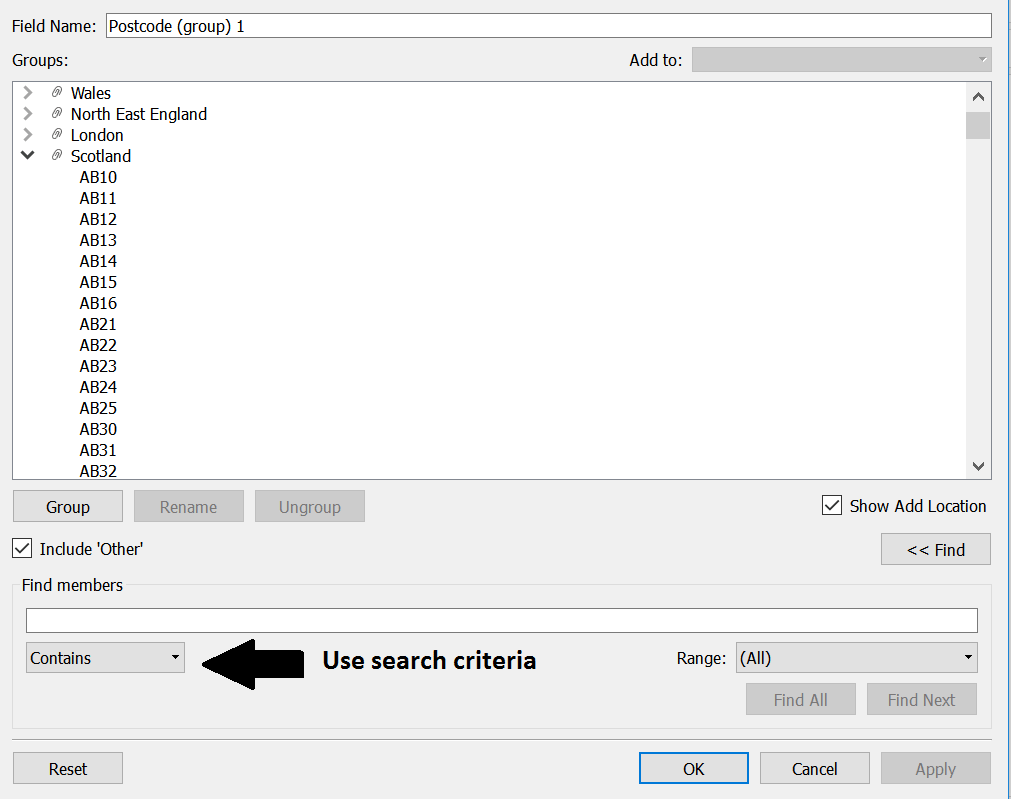
Now create groups in Tableau and group the postcodes which falls into that region like combine all the scotland postcodes(refer the image below). Use the search criteria to make your work easier. Here the column name is postcode you can name it anything you want.
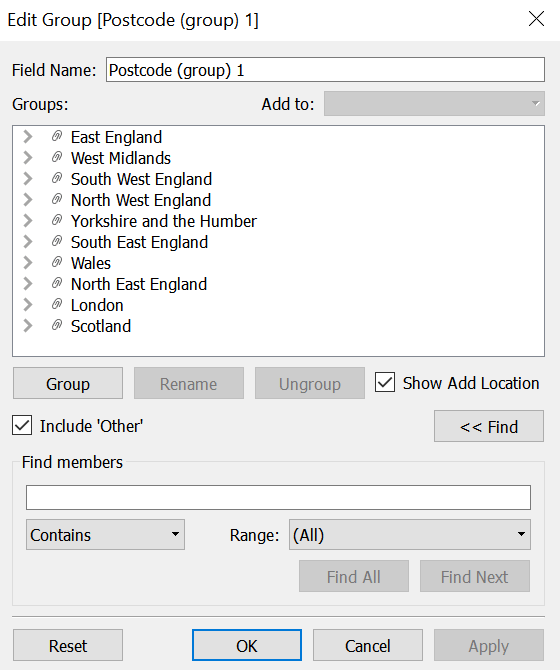
Once you are done with your group it should look something like the image below. Here I’ve created 10 groups, you can change the number of groups according to your requiredment.
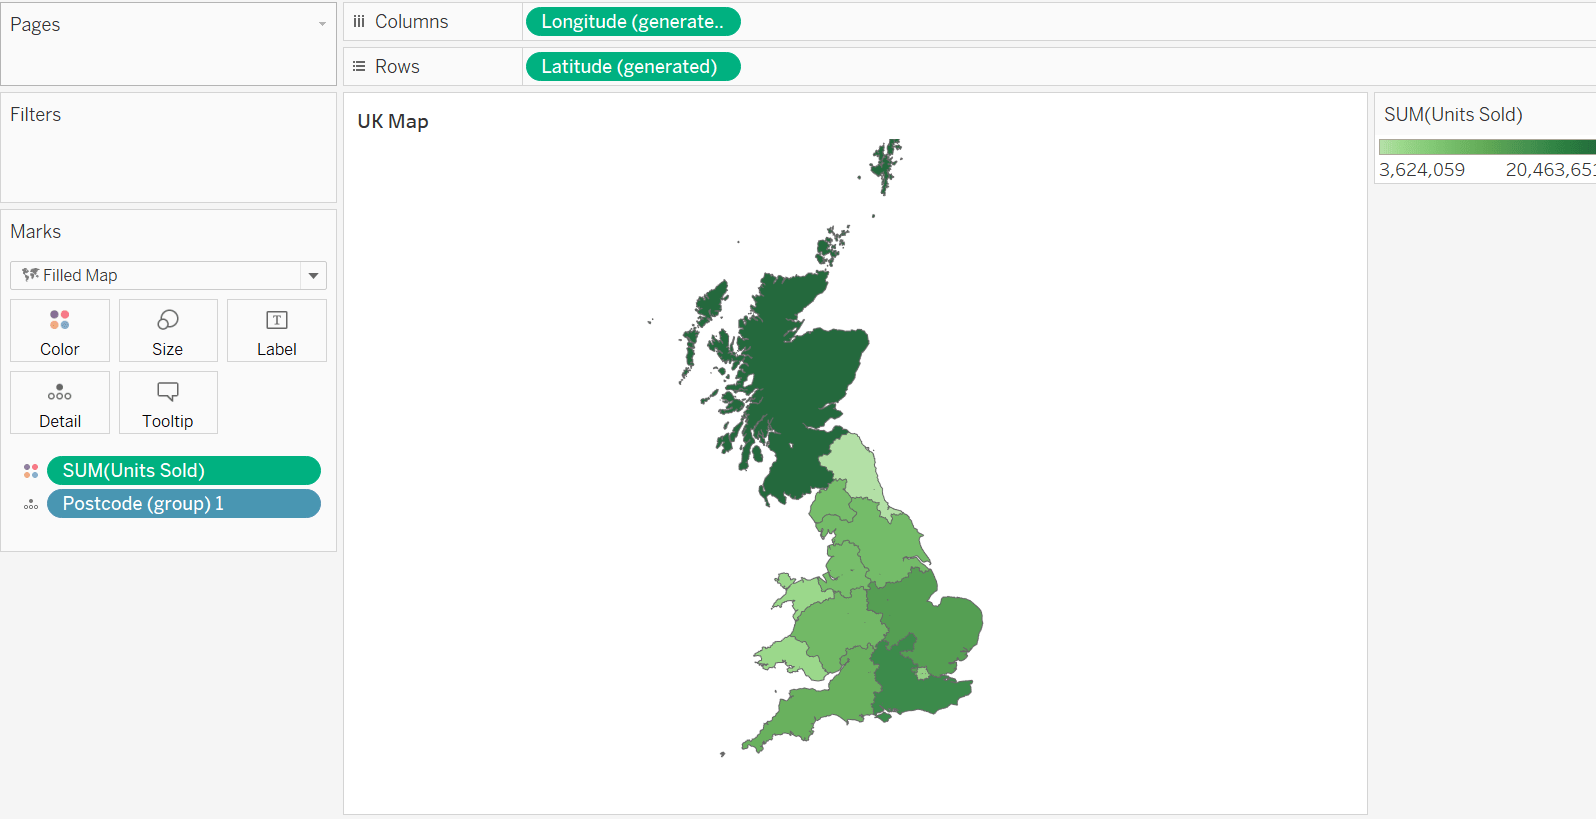
Once you complete the steps carefully you’ll get the following map and Thats done!
Click on the image below to interact with the dashboard. Since the earlier UK is not giving proper insights. You’ll also feel the difference between the two maps. I find regional map is much better.
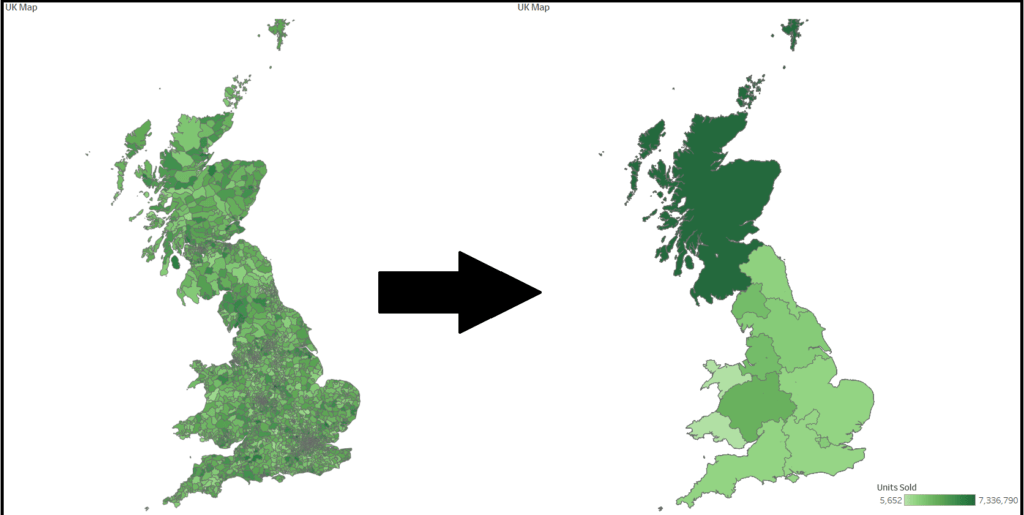
Before and After UK map
I’ve kept the tutorial very short and concise. Check out the Tableau public dashboard to download and reuse it.
Tableau Public Link
Sources:
Full list of UK postcodes
Regional postcodes
Regional postcodes
Thanks for reading! Comment your queries/suggestions.
Keep visiting Analytics Tuts for more tutorials.
Heya
Ths only issue is the Wales/Midlands borders aren’t correct
How would one correct this?
Heya
The only issue is the Wales/Midlands borders aren’t correct
How would one correct this?
Hi,
I didn’t notice may be you have check the grouping properly because the base map is from Tableau. If not then import map from 3rd party sites like mapbox.