
How to Screen Scrape Using R
STEP 1: BACKGROUND
Screen scraping is an effective technique that can be used to gather data off of web pages. Typically the data is gathered for further analysis or aggregation.
STEP 2: GATHER THE DATA
Install and load packages
R packages contain a grouping of R data functions and code that can be used to perform your analysis. We need to install and load them in our environment so that we can call upon them later.
#install packages - do this one time
install.packages("rvest")
install.packages("plyr")
install.packages("ggplot2")
install.packages("treemap")
install.packages("data.table")
# Load the relevant libraries - do this every time
library(rvest)
library(plyr)
library(ggplot2)
library(treemap)
library(data.table)
Create a screen scraping function and then call the function for all review pages.
Screen scraping is a very in-depth topic and it can get incredibly complicated depending on how the page you would like to scrape is formatted. Luckily the page we are trying to scrape allows the data objects we want to be referenced relatively easily. Since there are 6 pages total that we would like to scrape (all with the same format), I made a function that we can call for every page. Creating a function helps to prevent repeated blocks of code. This function takes two input parameters: the website URL that you want the data from and the category name you would like to assign to this data set. It then retrieves the apps title, rating count, download count, content rating (mature, teen etc), write up (description) and assigns the category you provided. Finally, it returns a data frame to you with all of the information nicely packed up.
###########  CREATE Function for Google Screen Scrape ################
scrapeGoogleReviews <- function(url, categoryName ){
#Specifying the url for desired website to be scraped
webpage <- read_html(url)
df <-data.frame(
app_title = html_text(html_nodes(webpage,'.id-app-title')),
rating_count = html_text(html_nodes(webpage,'.rating-count')),
download_count = html_text(html_nodes(webpage,'.download-count')),
html_text(html_nodes(webpage,'.content-rating-title')),
write_up = html_text(html_nodes(webpage,'.editorial-snippet')),
category = categoryName)
df
return(df)
}
###########  Call Function for Screen Scrape ################
#Call the function just created (scrapeGoogleReviews) for every "Best Apps" List
#Each web page hosts it's own "Best of 2017 App" list such s "Best Social", "Most Influential", "Best for Kids" etc.  The function is called for each web page and the results are placed in their own data frame.  We then put all the data frames together into one combined data frame with the rbind command.
df1 <-scrapeGoogleReviews('https://play.google.com/store/apps/topic?id=campaign_editorial_apps_bestof2017&hl=en','Winner')
df2 <-scrapeGoogleReviews('https://play.google.com/store/apps/topic?id=campaign_editorial_apps_entertaining_bestof2017&hl=en','Most Entertaining')
df3 <-scrapeGoogleReviews('https://play.google.com/store/apps/topic?id=campaign_editorial_apps_social_bestof2017&hl=en','Best Social')
df4 <-scrapeGoogleReviews('https://play.google.com/store/apps/topic?id=campaign_editorial_apps_productivity_bestof2017&hl=en','Daily Helper')
df5 <-scrapeGoogleReviews('https://play.google.com/store/apps/topic?id=campaign_editorial_apps_innovative_bestof2017&hl=en','Most Innovative')
df6 <-scrapeGoogleReviews('https://play.google.com/store/apps/topic?id=campaign_editorial_apps_Hiddengem_bestof2017&hl=en','Hidden Gem')
df7 <-scrapeGoogleReviews('https://play.google.com/store/apps/topic?id=campaign_editorial_apps_kids_bestof2017&hl=en','Best for Kids')
df8 <-scrapeGoogleReviews('https://play.google.com/store/apps/topic?id=campaign_editorial_3002de9_apps_bestof_mostpopular2017&hl=en','Most Popular')
#Combine all of the data frames
fulldf <- rbind(df1,df2, df3, df4, df5, df6, df7, df8)
#Peek at the data frame
head(fulldf)
STEP 3: FORMAT YOUR DATA
Download the full data set
Screen scraping is incredibly fragile as web page structure can change at any time. To ensure that those doing the tutorial can continue on with the visualizations, download the full dataset from GH
fulldf <- fread('https://raw.githubusercontent.com/lgellis/GoogleBestOf2017AppsAnalysis/master/GoogleBestApps.csv')
Convert to numeric
The downfall to screen scraping is that we often have to reformat the data to suit our needs. For example, in our data frame we have the two numeric variables: download_count and rating_count. As much as they look like numbers in the preview above, they are actually text with some pesky commas included in them that make conversion to numeric slightly more complicated. Below we create two new columns with the numeric version of these variables. The conversion is performed by first removing any non-numeric values with the gsub function and then converting to numeric with the as.numeric function.
###########  Extra formatting ################
# Remove commas and convert to numeric
fulldf$rating_count_numeric <- as.numeric(gsub("[^0-9]", "", fulldf$rating_count))
fulldf$download_count_numeric <- as.numeric(gsub("[^0-9]", "", fulldf$download_count))
attach(fulldf)
Create helper variables for easier analysis and visualization
There are some things just off the bat, that I know we will want for visualization. To start, it would be nice to have the percent of overall downloads for each app within the data set.
# Add percent downloads
totalDownload <- sum(download_count_numeric)
fulldf$percentDownloadApp <- round(download_count_numeric/totalDownload *100, 2)
attach(fulldf)
Next, we want to bin our download and rating totals. “Binning” is a way of grouping values within a particular range into the same group. This is an easy way for us to be able to look at volumes more
#Binning by downloads
breaks <- c(0,10000,1000000,10000000, 100000000)
fulldf$download_total_ranking = findInterval(download_count_numeric,breaks)
#Binning by rating totals
breaks2 <- c(10,100,1000,100000, 10000000)
fulldf$rating_total_ranking = findInterval(rating_count_numeric,breaks2)
attach(fulldf)
#peek at the data
head(fulldf)
STEP 4: ANALYZE YOUR DATA
Create a treemap to represent all app download volumes – Treemaps are perfect for visualizing volumes in a creative way. The treemap function offers the added benefit of not including titles for categories with minimal data.
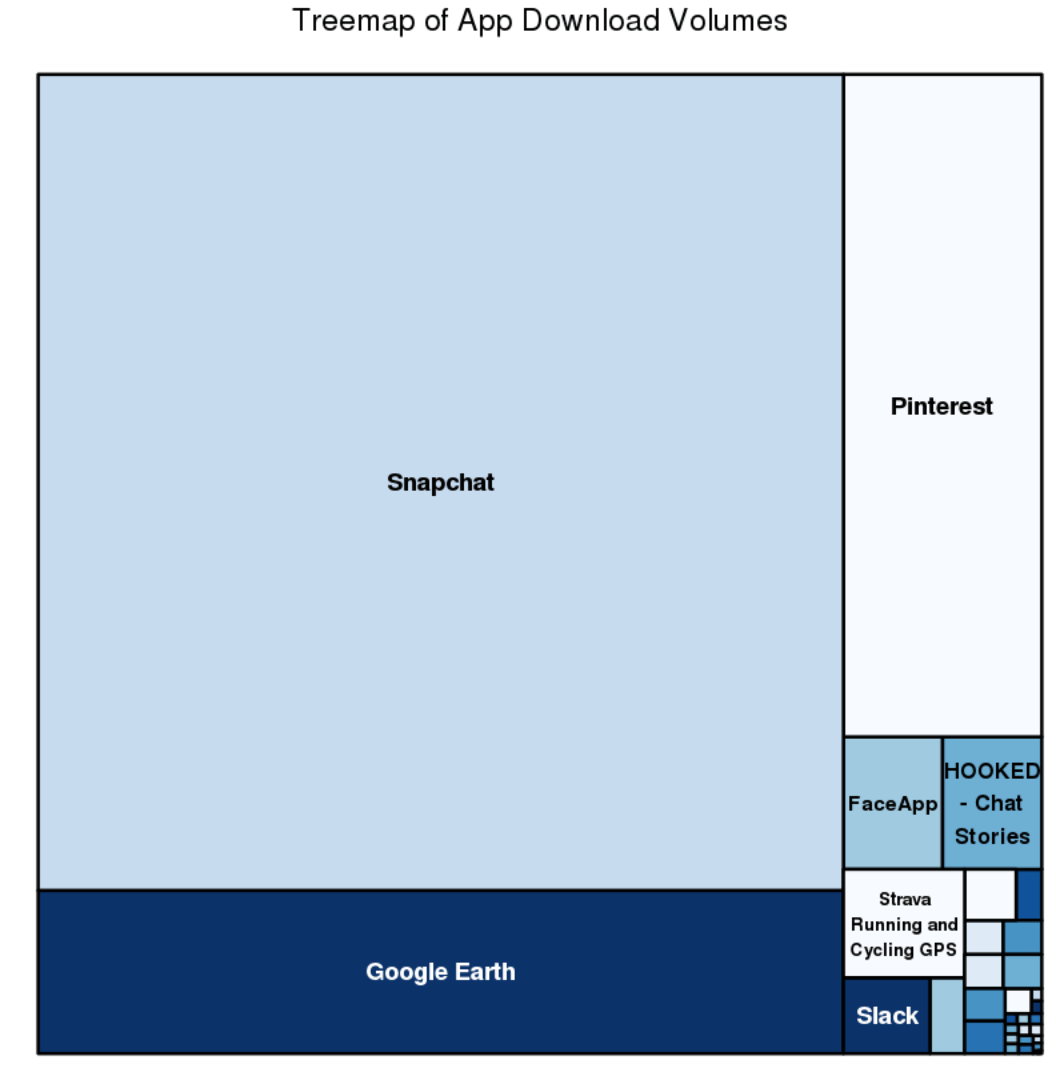
#Treemap without category
treemap(fulldf, #Your data frame object
index=c("app_title" ),
vSize = "download_count_numeric",
type="index",
palette = "Blues",
title="Treemap of App Download Volumes",
fontsize.title = 14
)
Create a bubble chart showing the top downloaded apps and the number of ratings they received.
We use the ggplot function again to create this bubble plot. The size of the bubbles represent the volume of downloads, the color represents the number of ratings. Given the disparity of download volumes, we only look at the top apps. We filter the data set to only include apps that have greater than 10,000,000 downloads.
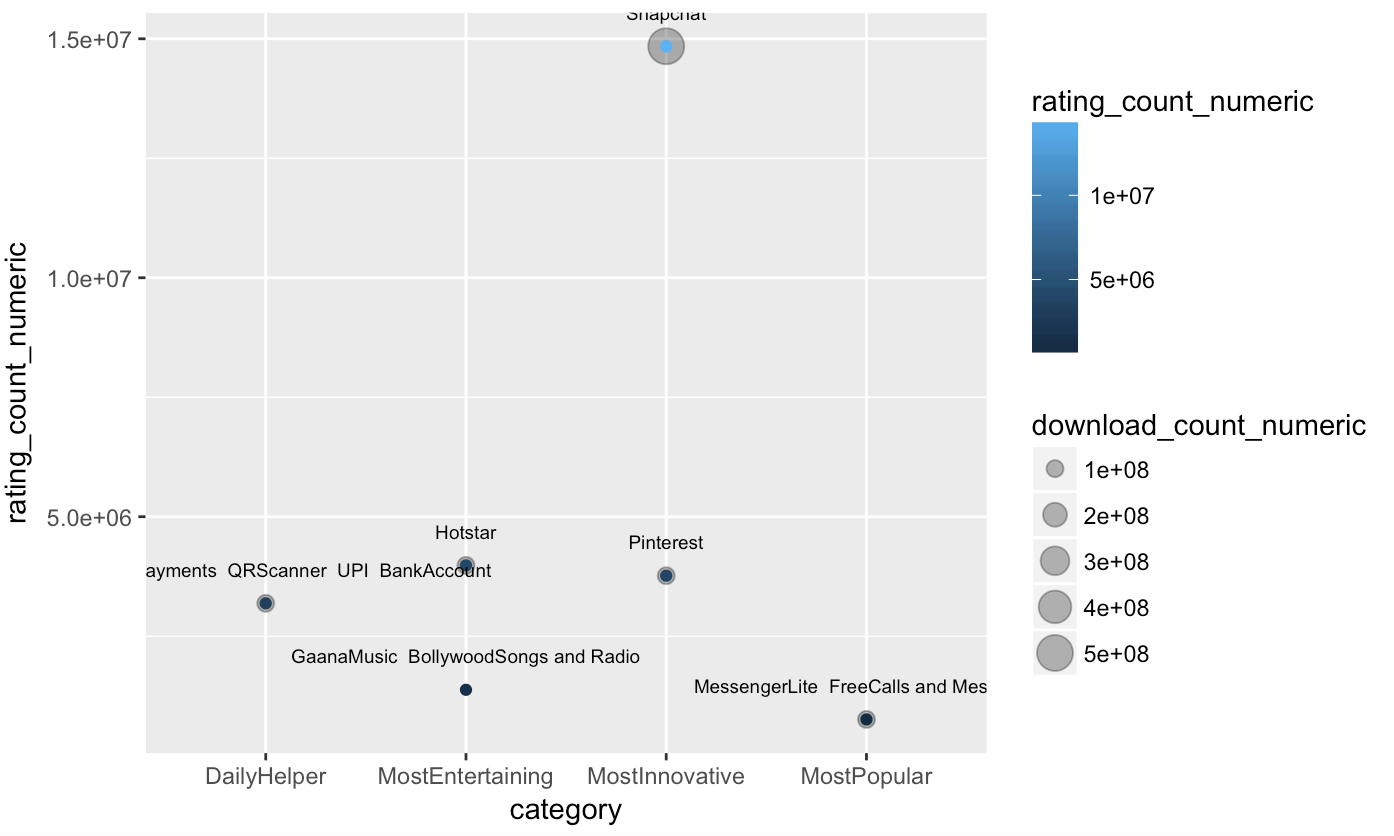
ggplot(data = fulldf[download_count_numeric>10000000, ], mapping = aes(x = category, y = rating_count_numeric)) +
geom_point(aes(size = download_count_numeric), alpha = 1/3) +
geom_point(aes(colour = rating_count_numeric)) +
geom_text(aes(label=app_title), size=2.5, vjust = -2) #vjust moves text up
Full post available here
Excellent Post