
Top N and Bottom N Values in single sheet in Tableau
Today we’ll be learning how to show Top 10 and Bottom 10 values in single sheet. To accomplish this we’ll be using Combined Set functionality of Tableau.
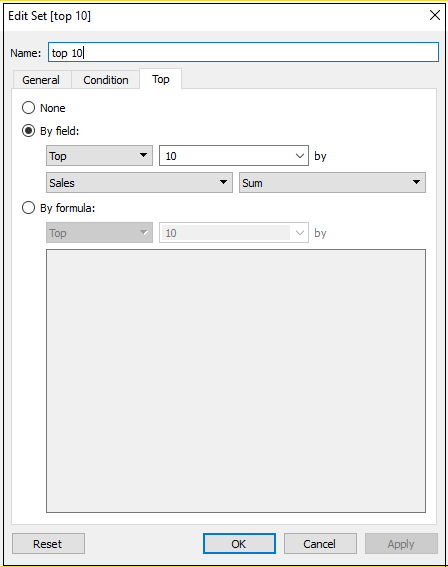
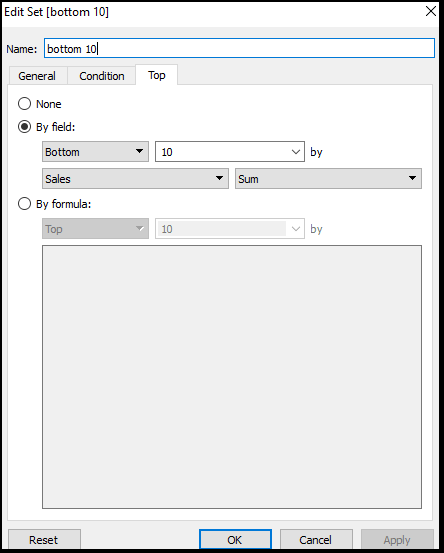
Step 1. For the first step create sets of States of Top 10 and Bottom 10 values by sales as shown in the image below. You can change the sets by the fields(dimension or measure).
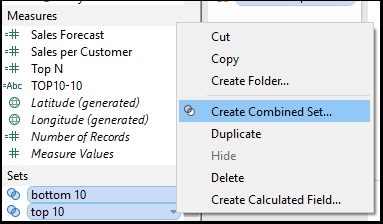
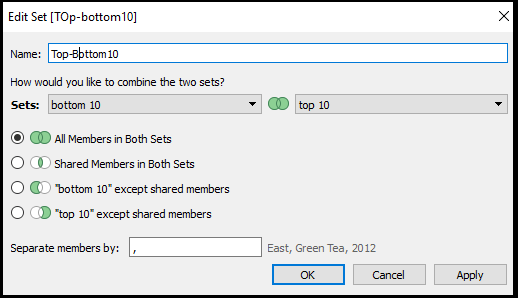
Step 2. In this step we’ll create a combined set. Select both the sets and right click and select Create Combined Set and then in the new window select All Members in Both Sets. Name the new set and Click ok.
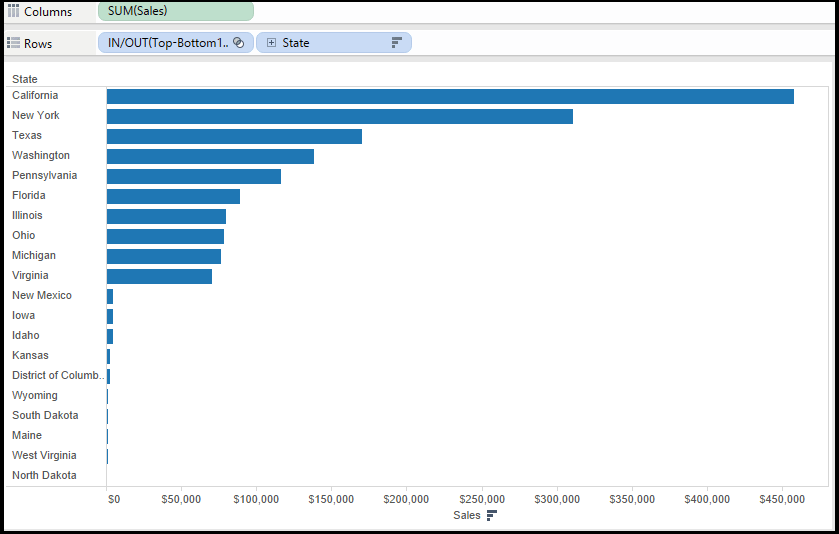
Step 3. In the final step create the chart by placing Sales in Columns shelf and State and created Combined Set in Rows shelf.
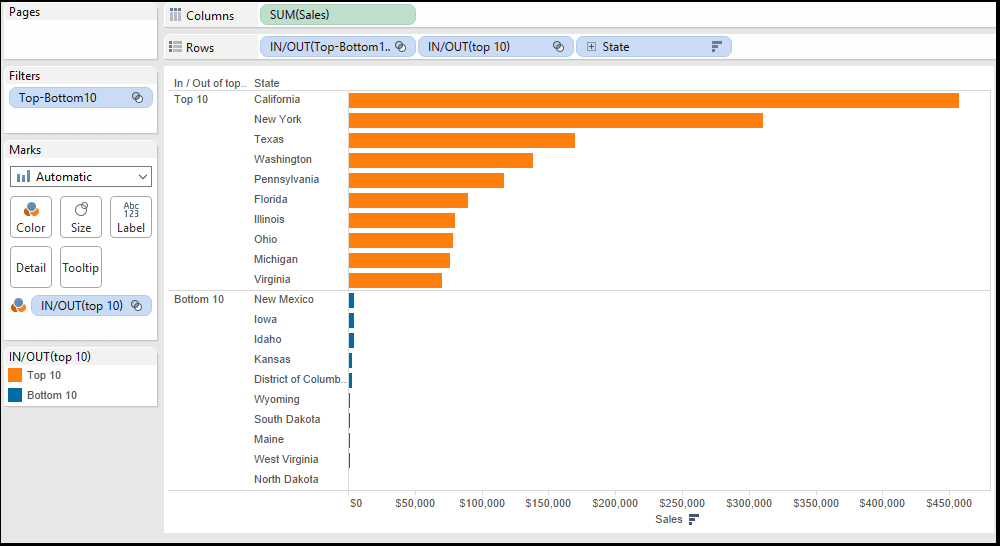
Now place the Top 10 set or Bottom Set in the Rows shelf and same set in the colors. If you’ve used Top-10 sets then IN will be top 10 values and OUT will be bottom 10 values.

Now change the alias of IN to TOP 10 and OUT to Bottom 10 as shown in the image below and that’s done.
This was pretty easy and useful tutorial. Keep visiting Analytics Tuts for more tutorials.
Really useful for beginners to Tableau. Thanks for sharing.
Very useful and amazingly simple. Thanks