
Top N values category wise in Power BI
Today we’ll be learning how to show Top N values Category wise in Power BI. The tutorial will be very useful in many context. 2 steps solution it is and I’ve attached the pbix file to download and reuse.
Data
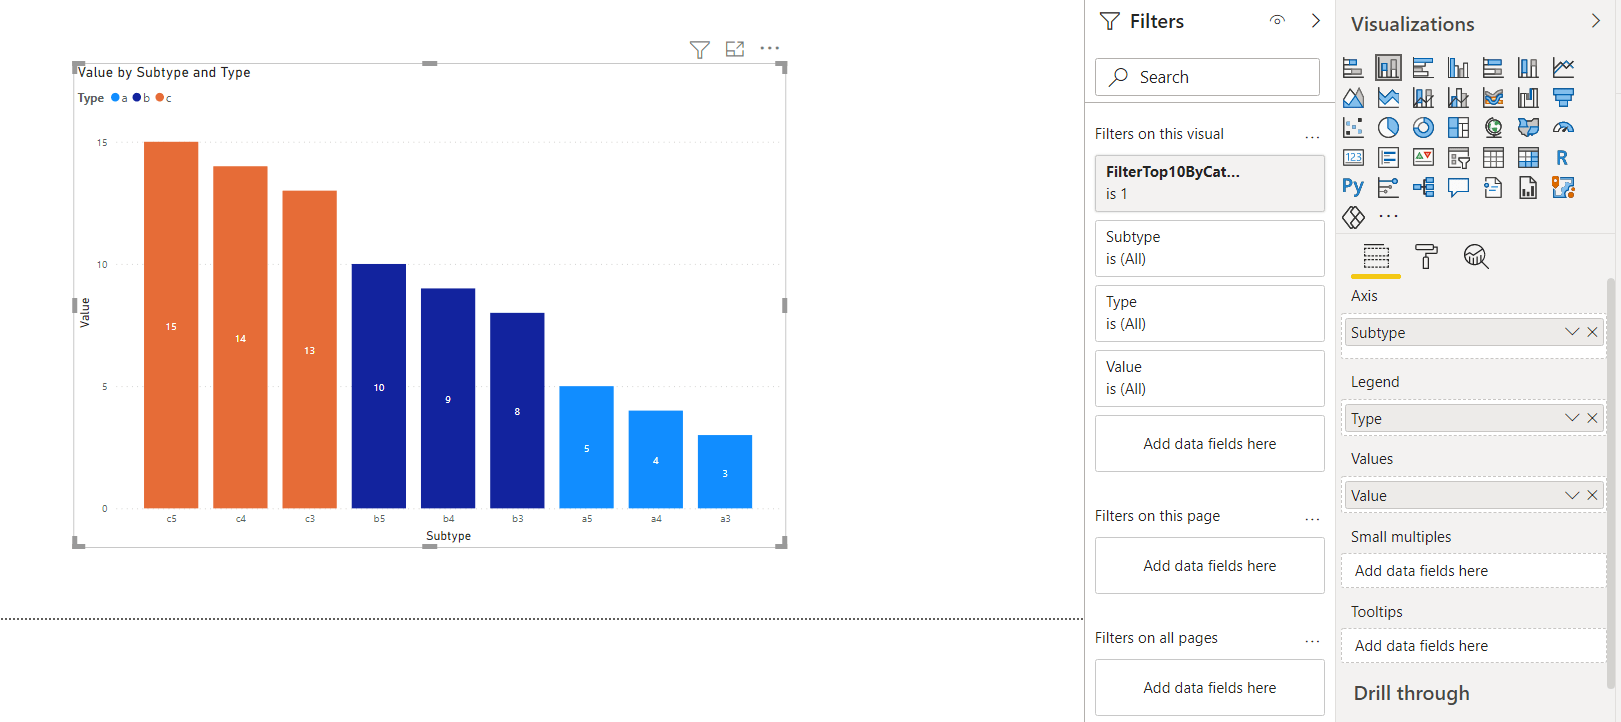
So I’ve data in the following format and I want to show Top 3 subtypes based on values for each type.
| Type | Subtype | Value |
| a | a1 | 1 |
| a | a2 | 2 |
| a | a3 | 3 |
| a | a4 | 4 |
| a | a5 | 5 |
| b | b1 | 6 |
| b | b2 | 7 |
| b | b3 | 8 |
| b | b4 | 9 |
| b | b5 | 10 |
| c | c1 | 11 |
| c | c2 | 12 |
| c | c3 | 13 |
| c | c4 | 14 |
| c | c5 | 15 |
Step 1 : Measure for values
Sales = CALCULATE(SUM('Table'[Value]))
Step 2 : TOP N measure
FilterTop3ByCat_Filter =
VAR Top3Cat =
CALCULATETABLE (
GENERATE (
VALUES ( 'Table'[Type]),
TOPN (
3, // instead of 3 you can use any number, currently showing top 3
CALCULATETABLE ( VALUES ( 'Table'[Subtype] ) ),
[sales]
)
),
ALLSELECTED()
)
RETURN
CALCULATE (
1 * ( NOT ISEMPTY ( 'Table') ),
KEEPFILTERS ( Top3Cat )
)
Download Power BI File
Keep visiting Analytics Tuts for more tutorials.
Thanks for reading! Comment your suggestions and queries