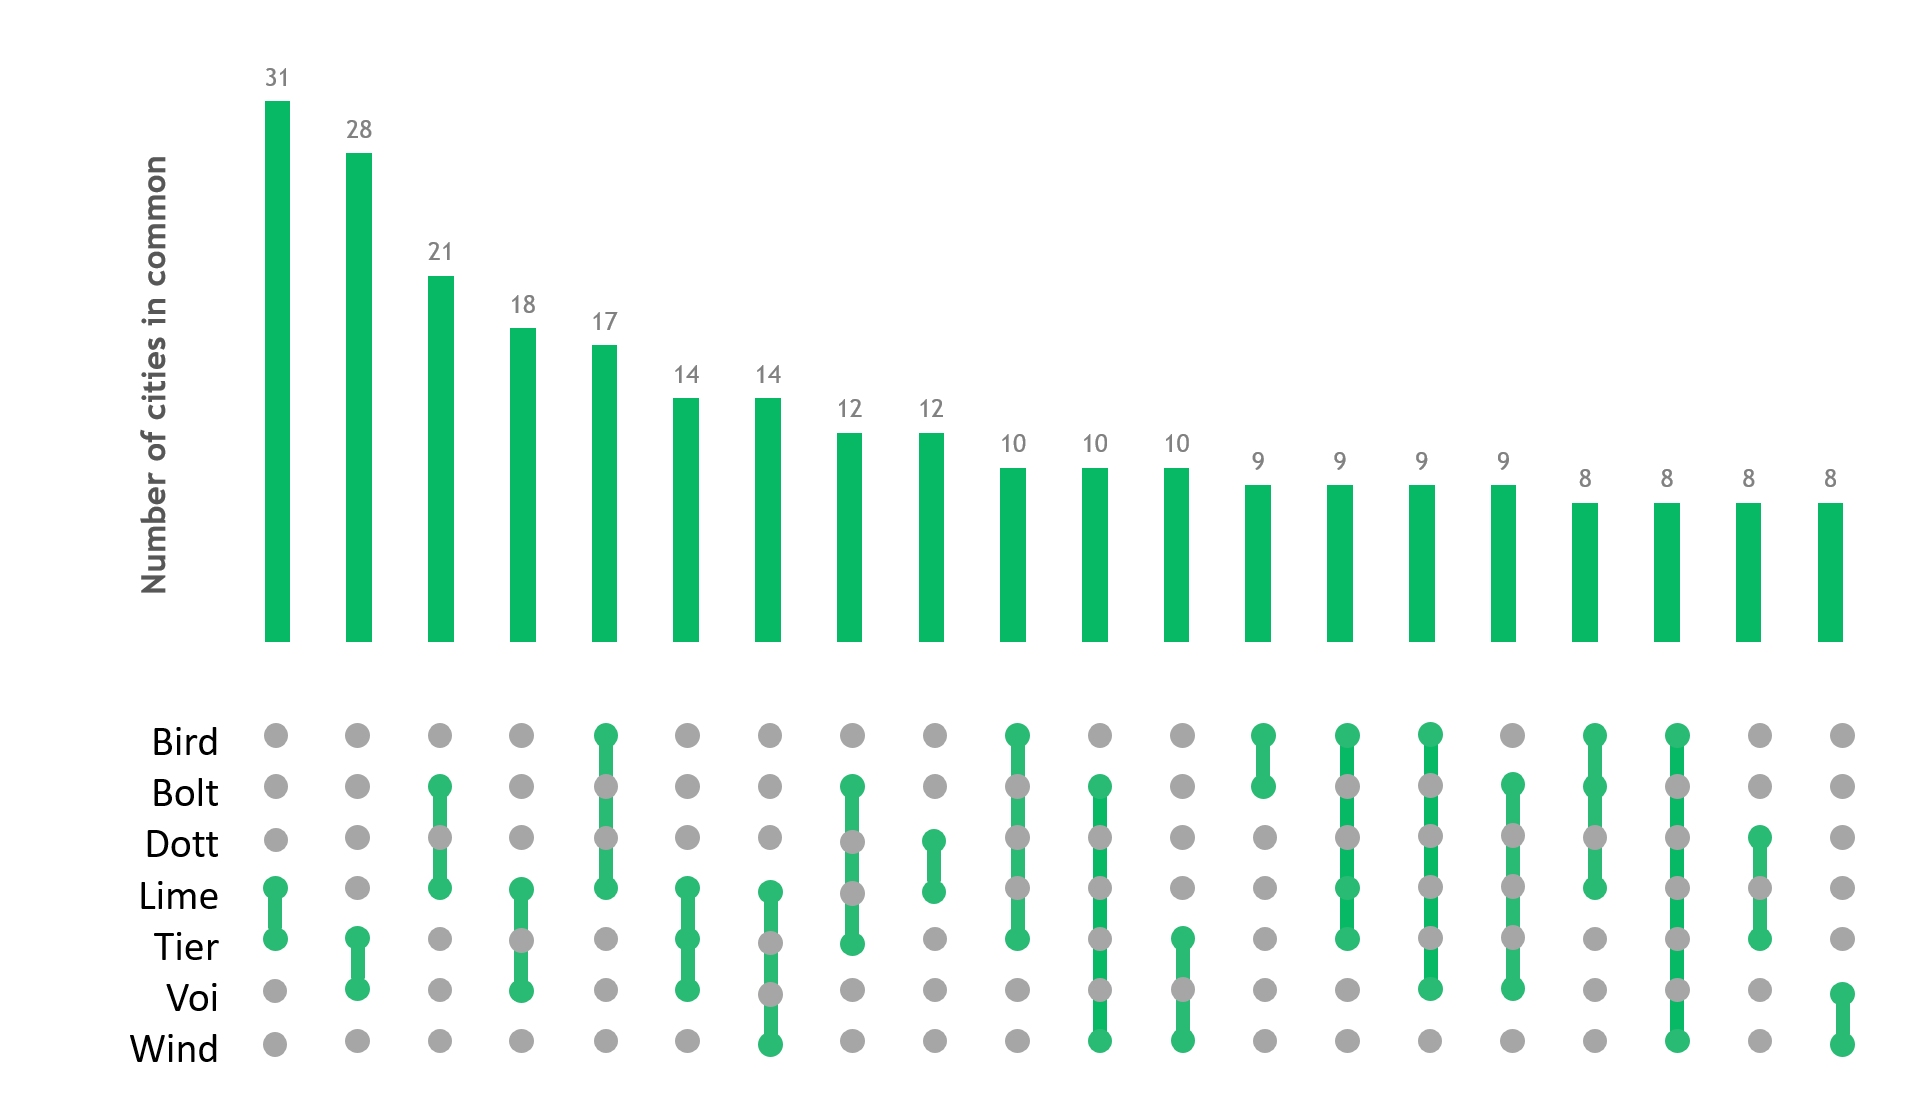
Upset plot in R
Upset plot is another form of Venn diagram and using the following code you can replicate is very easily with the code below.
#installing the packages
install.packages("UpSetR")
install.packages("ComplexHeatmap")
install.packages("colorspace")
install.packages("writexl")
install.packages("ggvenn")
#loading the packages
library(ggvenn)
library(UpSetR)
library(ComplexHeatmap)
library(ggplot2)
library(dplyr)
library(readxl)
library(writexl)
library(ggupset)
#reading the data
df <- read_excel("City.xlsx", sheet = "City")
#grouping and creating the list
df <- df %>%
group_by(Operator) %>%
summarize(City = list(City))
#creating the types for upset plot
lt = list(
Bird = df[1,2],
Bolt = df[2,2],
Dott = df[3,2],
Lime = df[4,2],
Tier = df[5,2],
Voi = df[6,2],
Wind = df[7,2])
#plot
make_comb_mat(list_to_matrix(lt))
m3 = make_comb_mat(lt, mode = "union")
UpSet(m3)