
Waterfall chart using multiple measures in Tableau
Hello friends! recently I got a requirement where the I had to create Waterfall chart using different measures. Data was not static but the format/structure was constant. Also data transformation was not allowed.
This is very simple to create it, follow the steps to achieve it.
The data format is look something like this. As you can see that the data is wide format not in the long format Day1,2.. are separate columns.
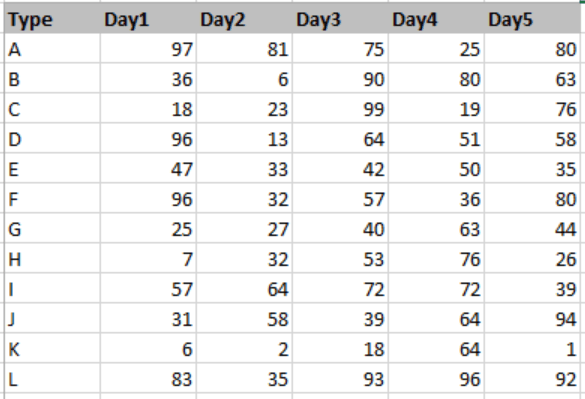
Data
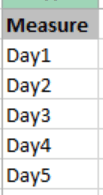
As a step 1 create a new excel sheet with just measure you want to add in the waterfall chart. I want Day1,2.. so I created a column with the measure names.
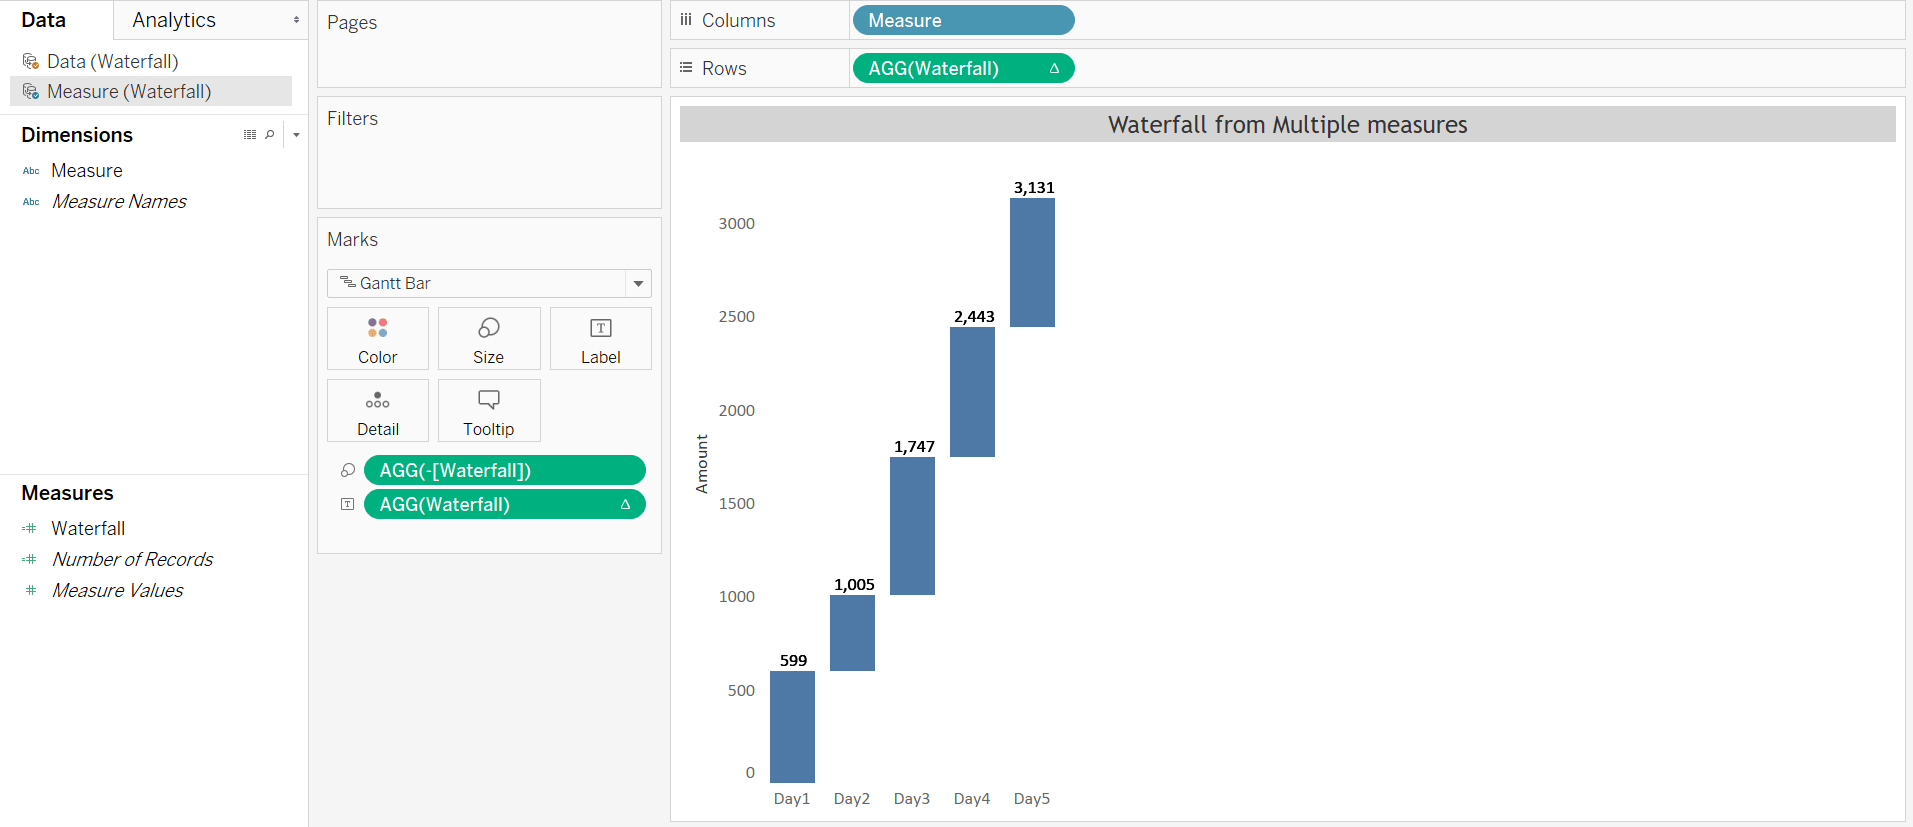
Now add these data sets to Tableau and in the sheet which has measure names create calculated fields as below.
CASE ATTR([Measure])
WHEN 'Day1' THEN SUM([Data (Waterfall)].[Day1])
WHEN 'Day2' THEN SUM([Data (Waterfall)].[Day2])
WHEN 'Day3' THEN SUM([Data (Waterfall)].[Day3])
WHEN 'Day4' THEN SUM([Data (Waterfall)].[Day4])
WHEN 'Day5' THEN SUM([Data (Waterfall)].[Day5])
END
Data (Waterfall)- Is the data source  with actual data
Now start creating the waterfall chart. Using the Measure name data set place
1. ‘Measure’ to Columns, Calculated field to Rows and make it running total
2. Chart type to Gantt Bar
3. -ve of calculated field to size
4. Calculated field to Label and done.
Keep visiting Analytics Tuts for more tutorials.
Thanks for reading! Comment your suggestions and queries.
Tableau Public
Tableau Dashboard
Indeed an easy way to show waterfall with multiple measures. But at the end of waterfall bar should be complete. i.e. It should start from 0 and show what is left. In this case last bar (Day 5) should show 3131 instead of 688.
Any idea how to achieve it?
Sorry, it is showing 3131 only but how to make Day 5 bar start from 0?
Day 5 will start from the max value of Day 4 which is waterfall. Can you please share what exactly you are looking for?
Thanks,
Niket
I think you just need to add a column total, so day 5 will start at the end of Day 4, and finish on 3131, then a grey bar will appear from 0 to 3131
Thank you, this is what I was looking for. Just one quick question, what if we need to apply apply filter on any dimension from Data (Waterfall) sheet? It is not allowing as there is no relation between two sheets (second sheet just has 1 measure), how can we do that?
Hey Puneet, Were you able to figure that out? I am ina similar situation and unable to find how to create tge relationship.
Me too
Hey Puneet / Ayushi,
did you happen to stumble upon a solution?
I read somewhere that you can do a cross join if you have in each data set a calculated field = 1. However, it doesn’t seem to work in my case, maybe because I’m using a published data source. I tried to change it in Data -> Edit Blend Relationship and joined the two field there, but no success…