
Arrange multiple plots using patchwork in R
Hello friends! we’ll be learning to arrange multiple plots using patchwork package in R. patchwork is awesome and extremely simple to use to compose to arrange your plots in single graphic. I’ll be recreating the Plot multiple charts in single layout in base R from my earlier blog post.
I’ll be using the Pokemon dataset from Kaggle. I’ll be doing density plot using different variables.
Loading package
library(ggplot2)
library(patchwork)
Reading data
df <- read.csv("Pokemon.csv")
Creating Plots
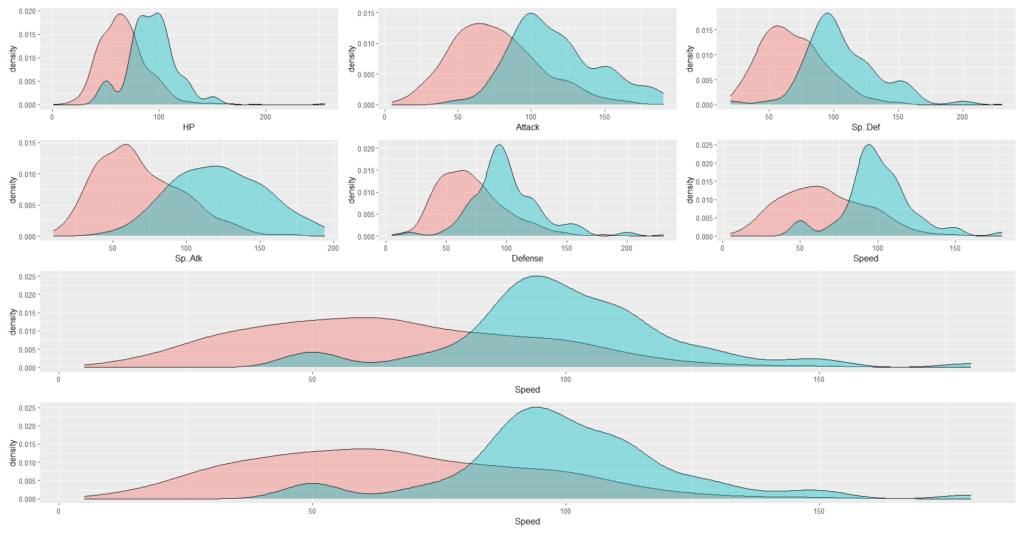
#Plot1----HP
p1 <- ggplot(df, aes(x=HP, fill=Legendary)) +
geom_density(alpha=0.4) +
theme(legend.position = "none")
#Plot2----ATTACK
p2 <- ggplot(df, aes(x=Attack, fill=Legendary)) +
geom_density(alpha=0.4) +
theme(legend.position = "none")
#Plot3---Sp..Def
p3 <- ggplot(df, aes(x=Sp..Def, fill=Legendary)) +
geom_density(alpha=0.4) +
theme(legend.position = "none")
#Plot4----Sp..Atk
p4 <- ggplot(df, aes(x=Sp..Atk, fill=Legendary)) +
geom_density(alpha=0.4) +
theme(legend.position = "none")
#Plot5---Defense
p5 <- ggplot(df, aes(x=Defense, fill=Legendary)) +
geom_density(alpha=0.4) +
theme(legend.position = "none")
#Plot6----Speed
p6 <- ggplot(df, aes(x=Speed, fill=Legendary)) +
geom_density(alpha=0.4) +
theme(legend.position = "none")
#Plot7----Total
p7 <- ggplot(df, aes(x=Speed, fill=Legendary))  +
geom_density(alpha=0.4) +
theme(legend.position = "none")
We have created the 7 plots, now we have to arrange as we did Plot multiple charts in single layout in base R
Arrange plots
#command to arrange the plots
(p1|p2|p3)/(p4|p5|p6)/p7
"|" or "/" operator will arrange side by side or below depending on the use
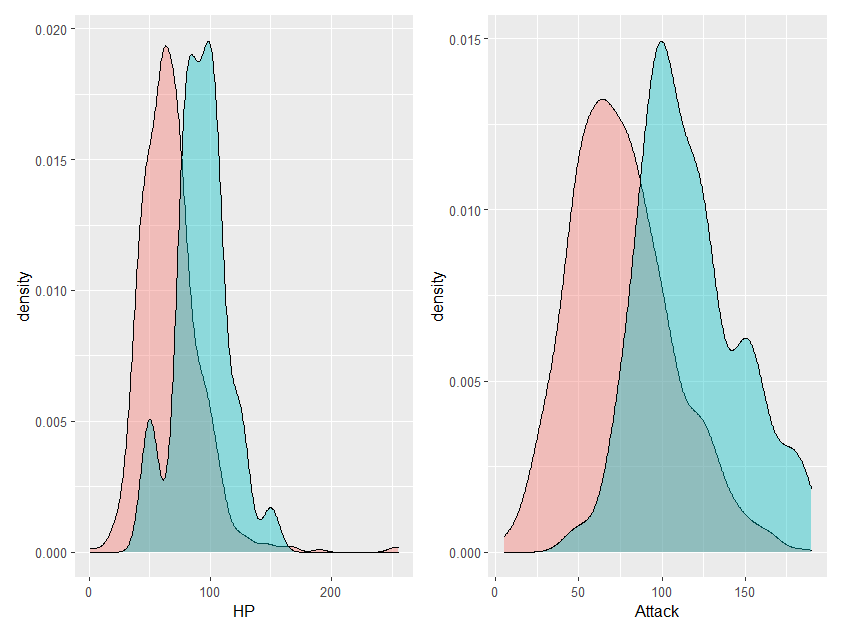
Example 2: To arrange side by side
p1|p2
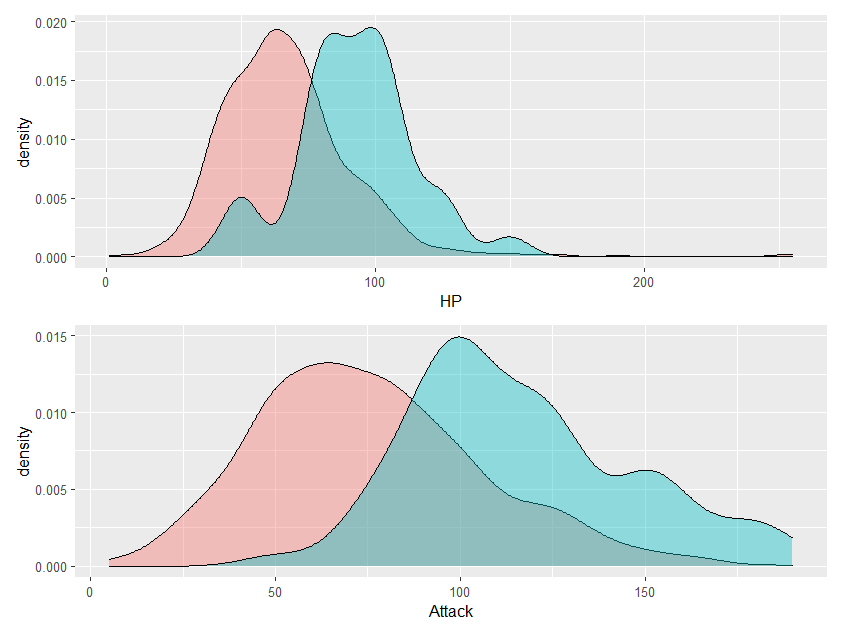
Example 3: To arrange 1 below the other
p1/p2
Keep visiting Analytics Tuts for more tutorials.
Thanks for reading! Comment your suggestions and queries