
Control a single Chart with Multiple Dimensions and Measures in Tableau
Today we’ll be learning to control a single chart with multiple Dimensions and Measures in Tableau or in other words adding different X and Y axis for a chart. We’ll also learn the use of Parameters in Tableau. Tableau work book is attached for download. I have used Superstore Data for the tutorial.
Step 1. Creating Parameters
For the first step we’ll be creating parameters for both measures and dimensions. Create a new Worksheet and in the Parameter card from the left panel right-click and select ‘Create Parameter’.
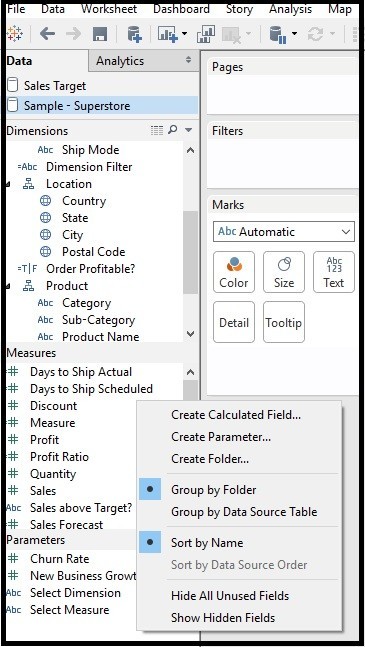
Now a window will pop-up to create Parameter. Here we’ll be creating parameter for Measure.
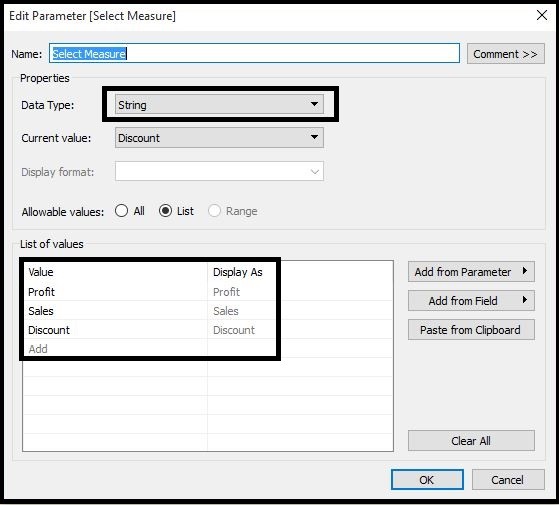
Give any name for the parameter then select ‘String’ as Data Type and Type the values of Measures you want to add to your Chart/Visualization and click OK. I have added Profit, Sales and Discount as measures.
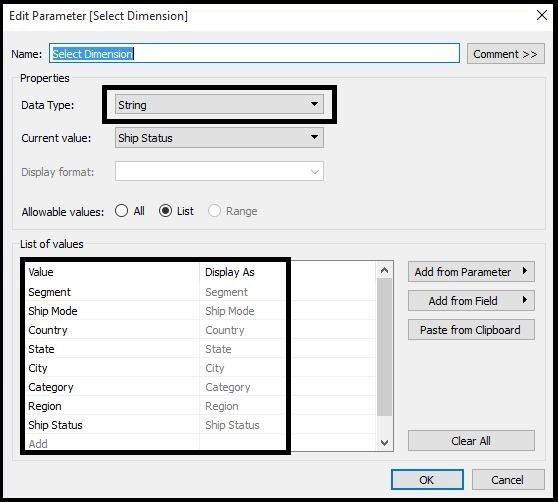
Now we’ll be creating the parameter for Dimension repeat the same steps for Dimensions too and add all the dimensions you want to show in your visualization. I have added total 8 values in the dimensions parameter.
Step 2. Creating Calculated Fields
In this step we’ll be creating Calculated fields for the Dimensions and Measures. Go to Analysis > Create Calculated Field. A window will pop-up to create the calculated field.
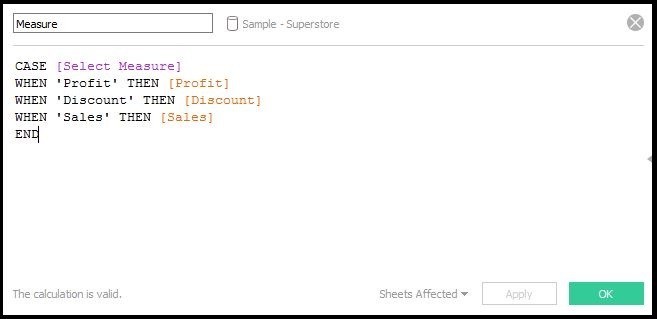
First we’ll be creating a calculated field for Measure. We can see the calculated field formula in the image below. It works as:
For 'Select Measure' Parameter, when we select 'Profit' it will return the [Profit] from
measure,for 'Discount' we'll get [Discount] from measure and for 'Sales' we'll get  [Sales]
from measure.
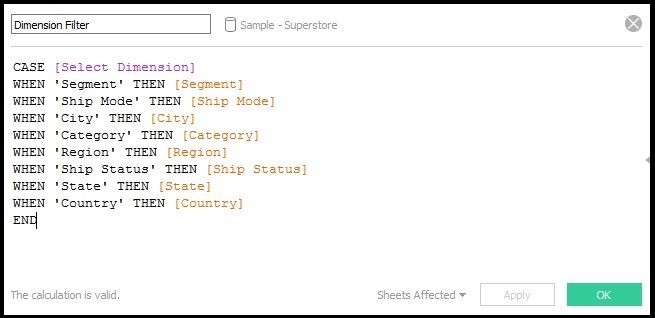
Now we’ll create calculated field for Dimensions. Used formula is shown below, add the values we have added to the ‘Select Dimension’ parameter. The formula works as:
For 'Select Dimension' Parameter, when we select 'Segment' we'll get [Segment] from the
dimension and so on.
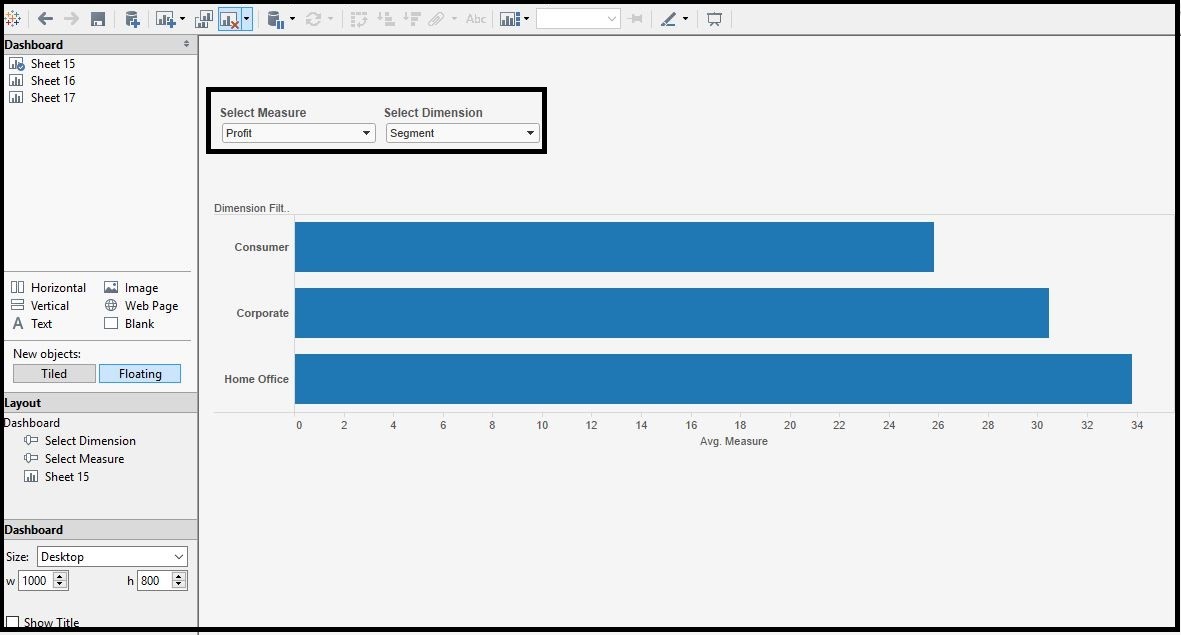
Step 3. Creating Final Visualization
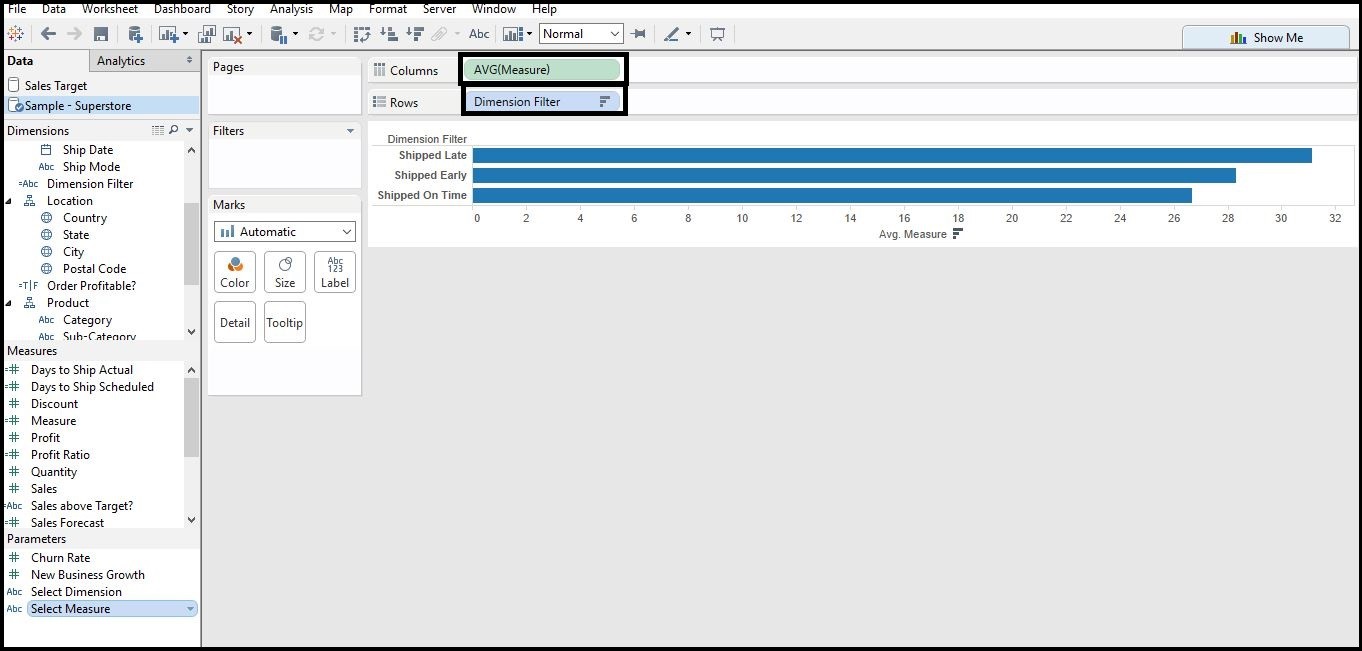
In the final step we’ll creating final visualization. For the final viz add the Calculated field to column and Rows shelf. Here I have added Calculated field Measure to Column shelf and Dimension Filter field to Rows shelf.
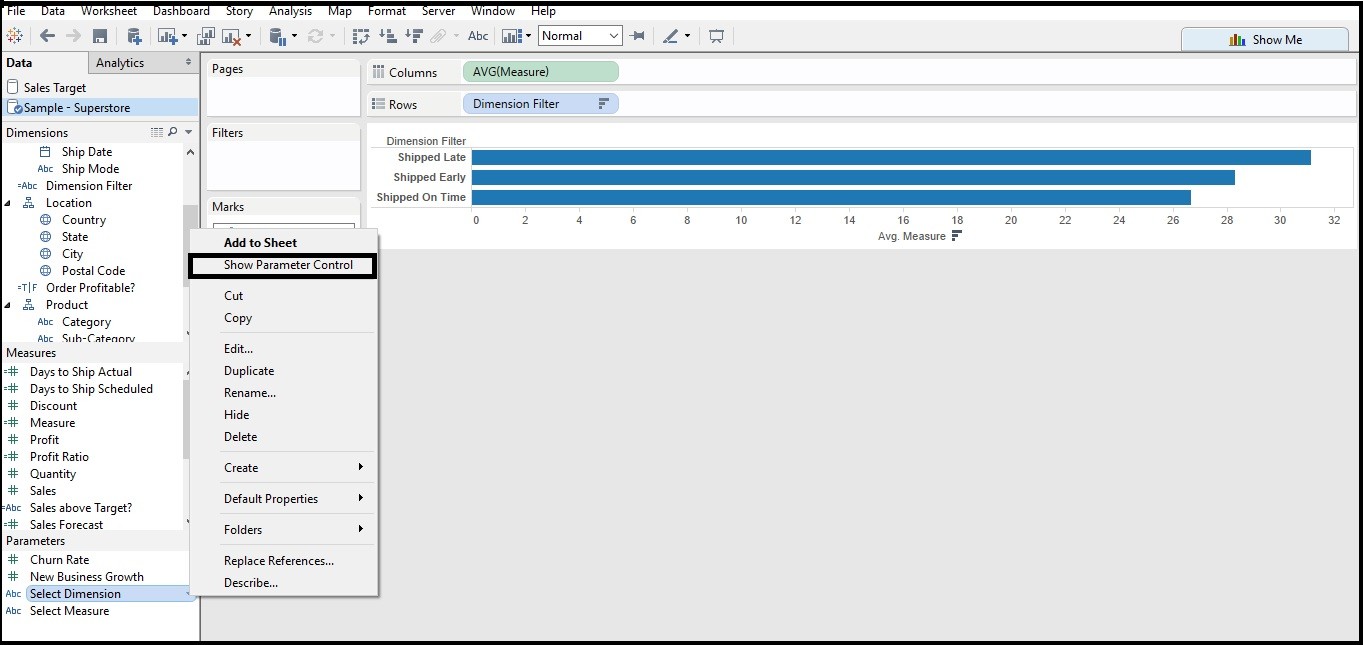
Now select the created parameter and click on Show Parameter control for both the parameters.
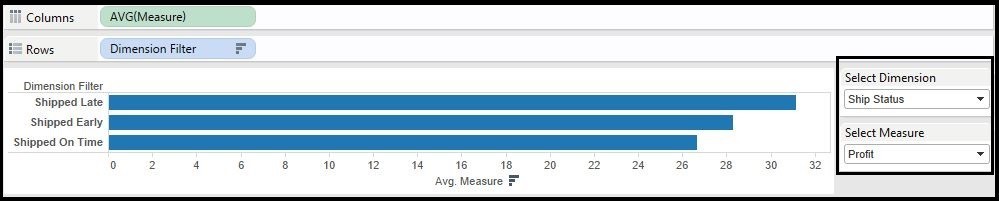
We can the Parameters in the right side. Now select create any viz the Dimensions and Measure.
Now add this sheet to a new Dashboard and that’s done.
With this technique we don’t have to create multiple charts. We can control the same chart with multiple Dimensions and Measures. Keep visiting for Tableau and More Analytics tutorials.
I’m trying to do this but with the option for a parameter to add more dimensions. Like:
CASE [Select Measure]
WHEN ‘Profit’ THEN [Profit]
WHEN ‘Discount’ THEN [Discount]
When ‘ProfitandDiscount’ THEN [Profit] and [Discount]
END
I get an error about ‘and’ string and string and it won’t work. Is there anyway to do this? Thanks.
Hi K’lila,
We can not use different data types in parameter. It should be same data type. Can you please explain more about final outcome you want so that I can explain you better. If You are creating data table then use STR([Profit]) +” “+ STR([Discount]) else mail me I’ll provide the solution for the same.
Hello there,
I am trying to set up my dashboard with filters for dimensions and measures to make it more dynamic and followed the above instructions.
However I am getting nulls on my dashboard, when i add the same dimensions and measures indivisually on a new sheet, i get the desired graph.
Can you help?
Thank you,
Hi Akchat.. Can you elaborate more?