
Creating Heatmap in R
Today we’ll be seeing to create the Heatmap in R. In my last tutorial I’ve created the heapmap in Tableau.
Here I’ve used the same data downloaded from Kaggle. Heatmaps are visually appealing with quick and easy to get inference. Follow the quick and easy tutorial.
Installing the necessary R packages
#installing  packages
install.packages("plyr")
install.packages("ggplot2")
install.packages("dplyr")
install.packages("lubricate")
#loading packages
library(plyr)
library(ggplot2)
library(dplyr)
library(lubridate)
Read Data
#reading the data
call911<- read.csv("911.csv")
#checking the data
head(call911)
Extracting hour and weekday from the datetime column
#extracting hour from the timestamp column
call911$hour<- hour(call911$timeStamp)
#extracting weekday from the timestamp column
call911$weekday<- weekdays.POSIXt(as.Date(call911$timeStamp))
Finding the number of calls of Weekday and hour pair
Method 1:

#Finding the count of hour and weekday pair using aggregate function
heatmap <- aggregate(e~ hour+weekday, data= call911, length)
Method 2:
#Finding the count of hour and weekday pair using count function
heatmap1 <- count(call911, hour, weekday)
Creating the Correlation matrix Heatmap step by step
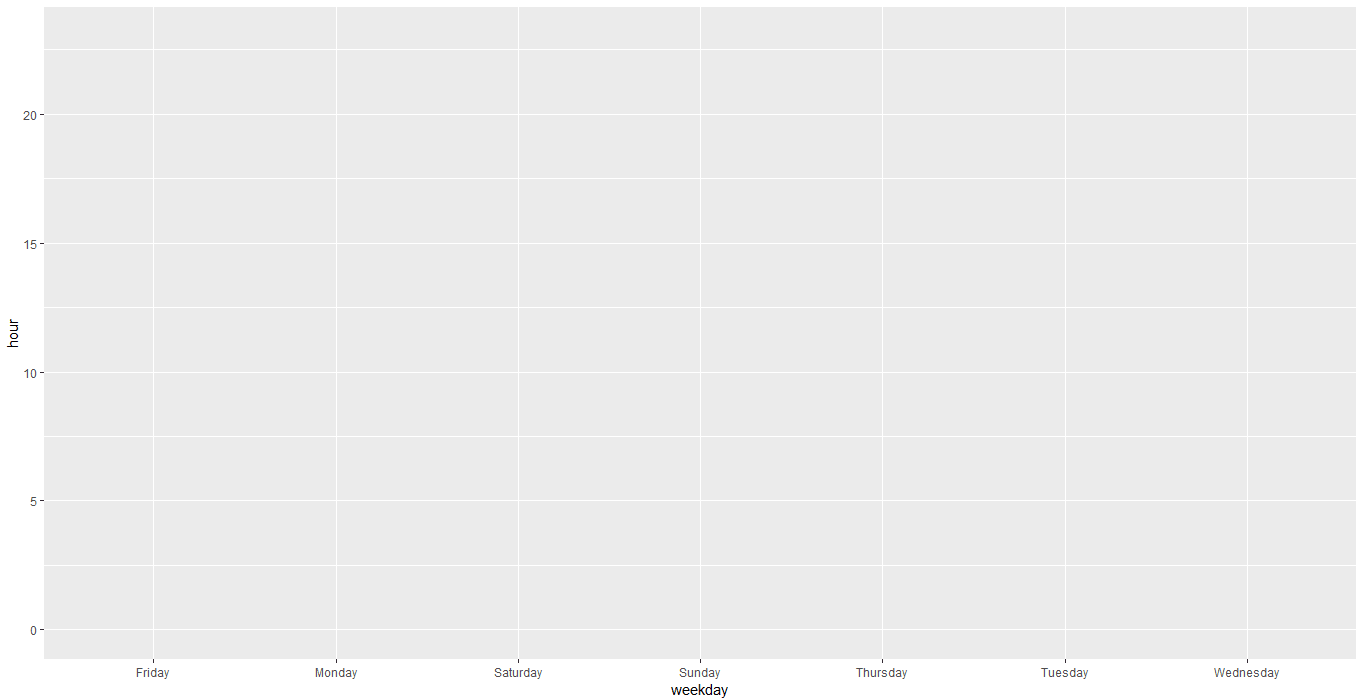
Creating a basic background as shown below
plot <- ggplot(data = heatmap, aes(x=weekday, y=hour, fill=e,label= e))
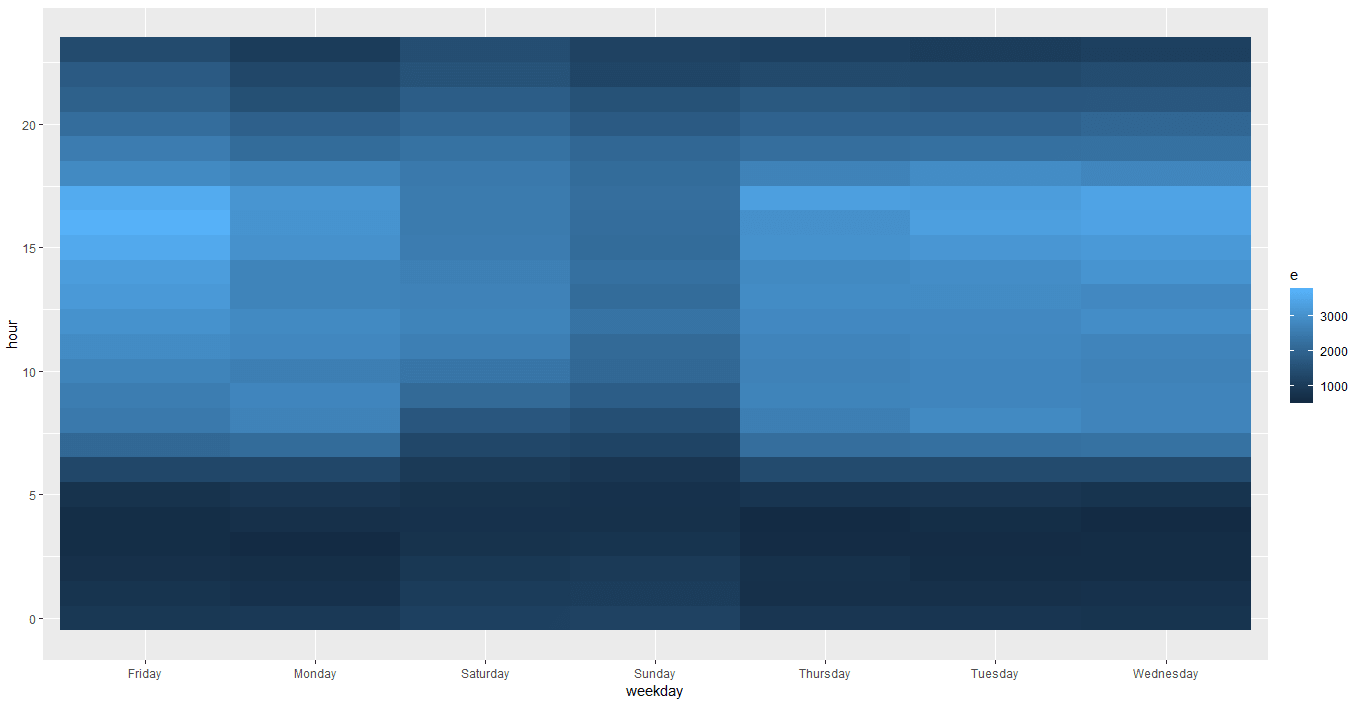
Adding layers to the base
plot_tile <- plot + geom_tile()
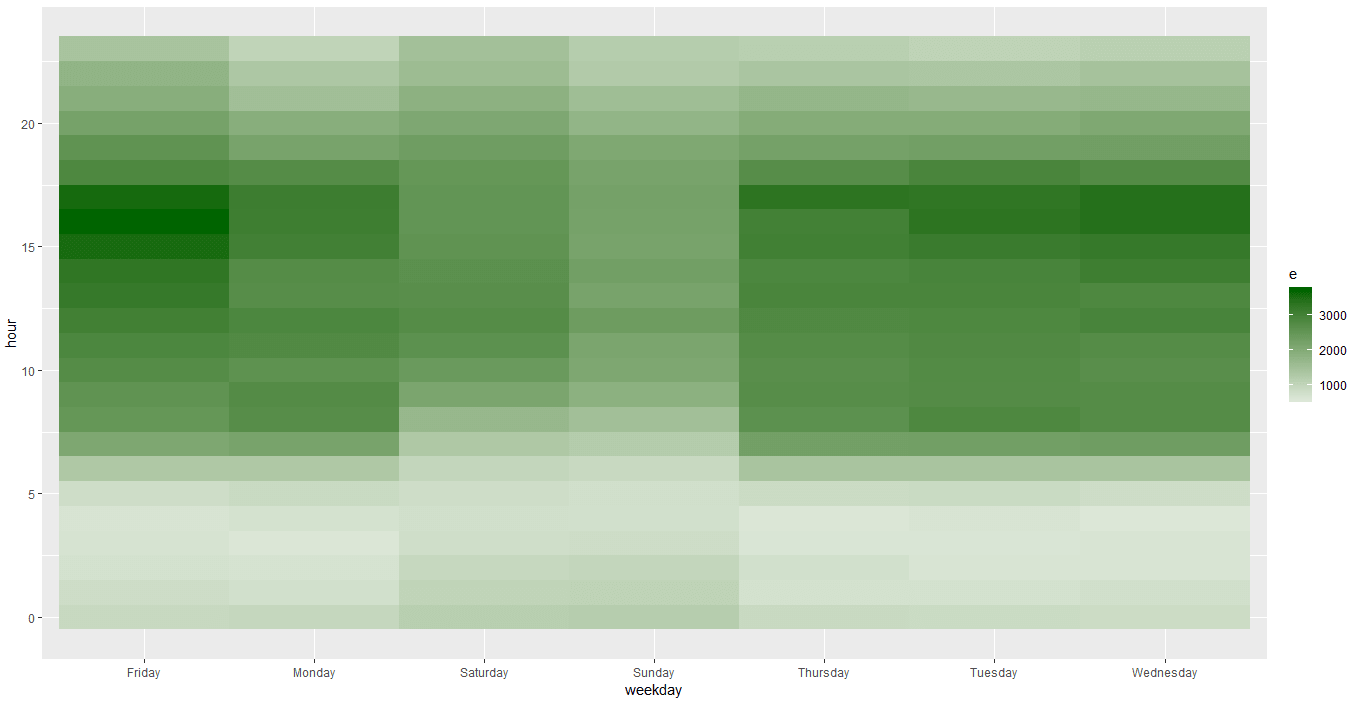
Adding the color scale to other than default
plot_fill_color <- plot_tile + scale_fill_gradient2(low = "#98FB98",high ="#006400")
Removing the tick-marks and cleaning the chart
final_plot <- plot_fill_color+theme_minimal()+theme(panel.grid.major = element_blank(), panel.grid.minor = element_blank())
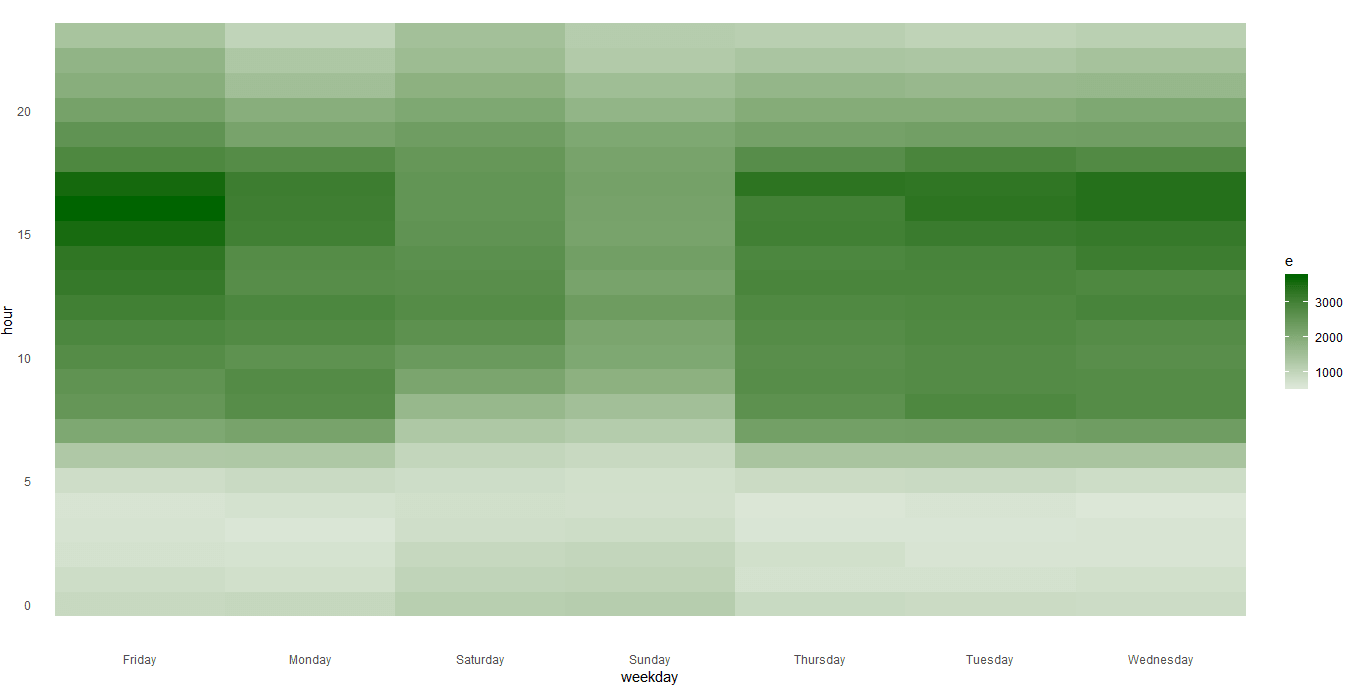
There are more changes which can be done here like making it dynamic to choose the columns, adding tool tip, dynamic color scale etc. Check out my other tutorial on heatmap in R.
Keep visiting Analytics Tuts for more tutorials.
Thanks for reading! Comment your suggestion and queries.
Seems like method2 syntax is little different while mentioning the variable names. Something like below:
heatmap1 <- count(call911, c("hour","weekday"))
Please check. Thank you!
Hi Nitesh,
I use the same syntax as I mentioned in the blog. I reconfirmed the syntax you’ve provided and it’s not working for me (due to version issue I guess).
Please use the syntax I’ve provided and let me know if it works for you.
Thanks,
Niket