
Dependent or Cascaded filters in Tableau
In this tutorial we’ll be learning how to make filters dependent on each other in Tableau also known as cascaded filters.
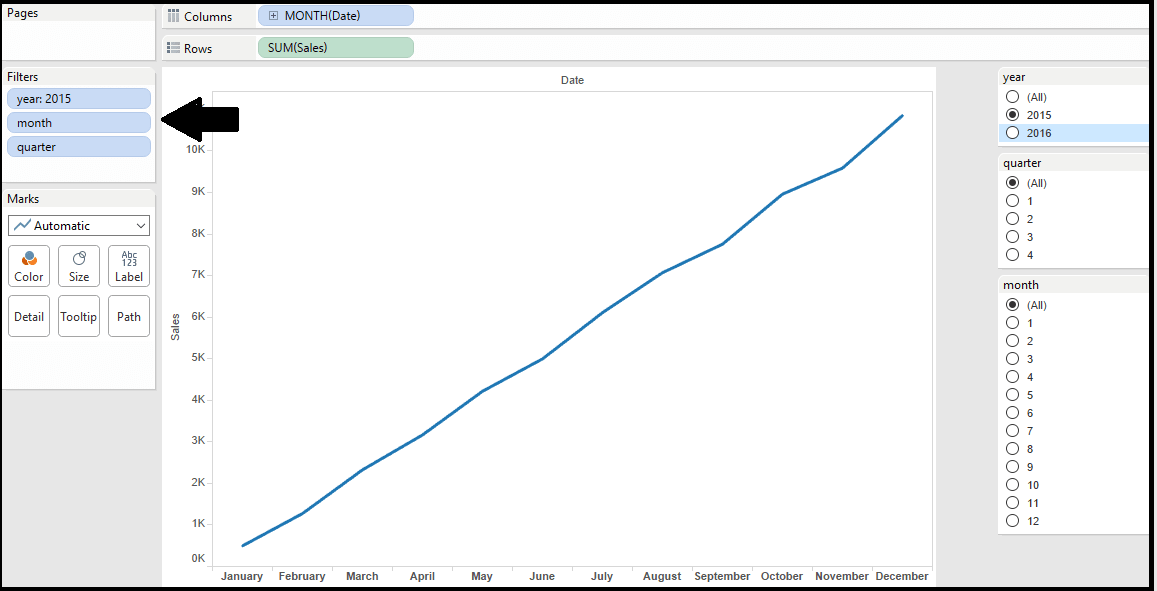
Let us take a scenario where we want to use three filters Year, quarter and month in a dashboard. All the three filters are dependent on each other but Year is primary filter and others are secondary filters. When we select Year the quarters which comes under that particular year will only appear in the Quarter filter and same for month.
Let us see the example below for better understanding.
1. First create a chart or visualization to show in the dashboard and put Year,Month and Quarter
in Filters.
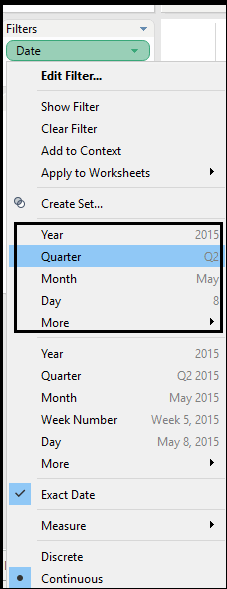
If you don’t have separate year,quarter or month dimension and have only Date field. You can place date field 3 times in filters card and select Year,Quarter and Month after clicking drop down icon on date field as shown in the image below.
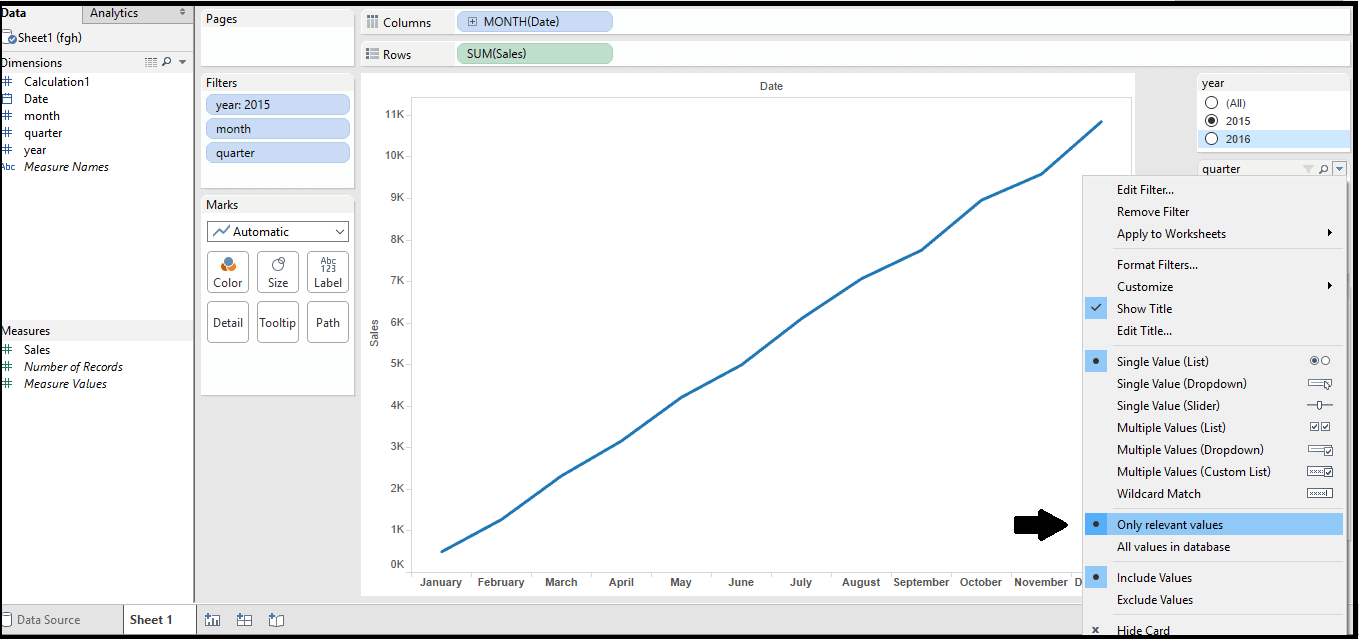
2. Now Select show filter and click on the drop down icon on the filter and select ‘Only relevant values‘ and that’s done.
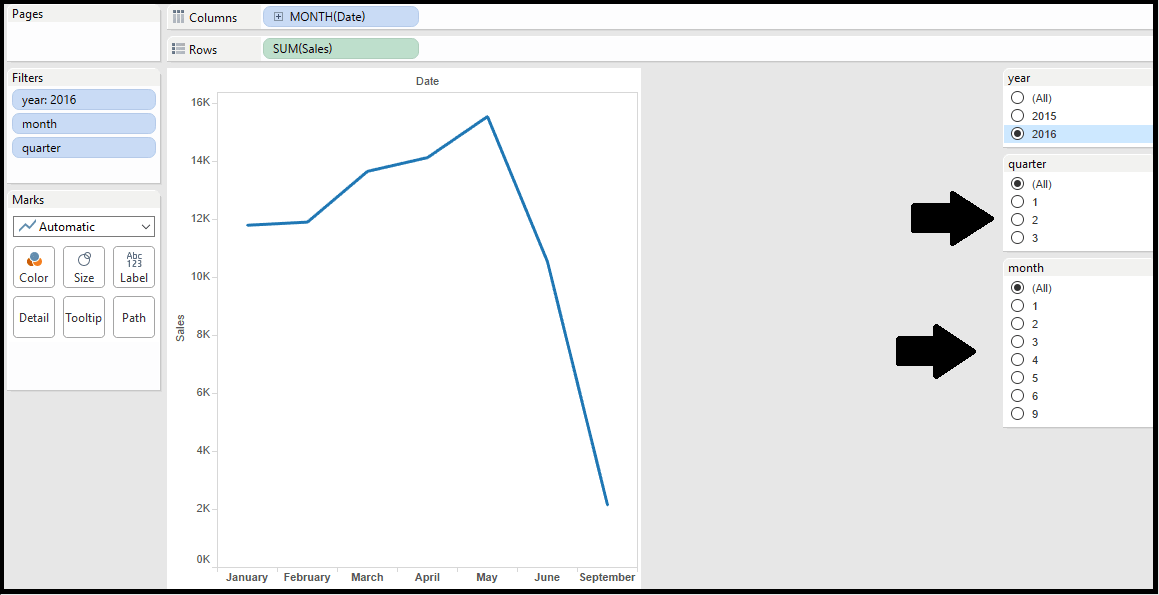
We can see (in the image below) when we select 2016 the quarter filter is having only three quarter corresponding to the year 2016 and same for the month.
So this was pretty simple and very useful method to use for filters in Tableau worksheets or dashboards,
Thanks for reading! Comment you suggestions and keep visiting Analytics-Tuts for more tutorials.