
Google Charts and Animation in Tableau
Today we’ll be learning to make Google charts and use of Pages in Tableau. You might have seen Google public data explorer if not please check out the link. The Data file and the workbook is attached for downloading.
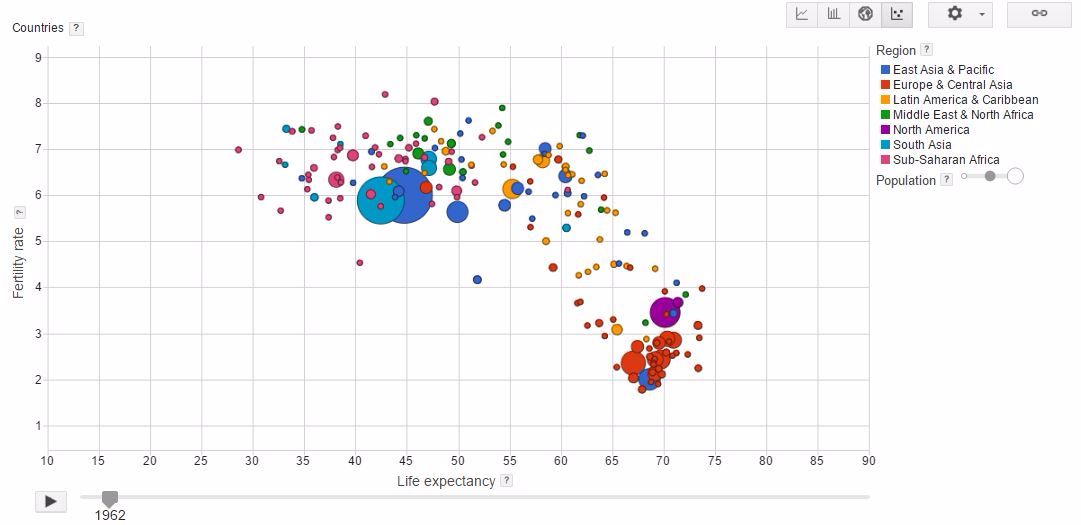
image source: Google public data explorer
We’ll be learning to make the same kind of chart in Tableau
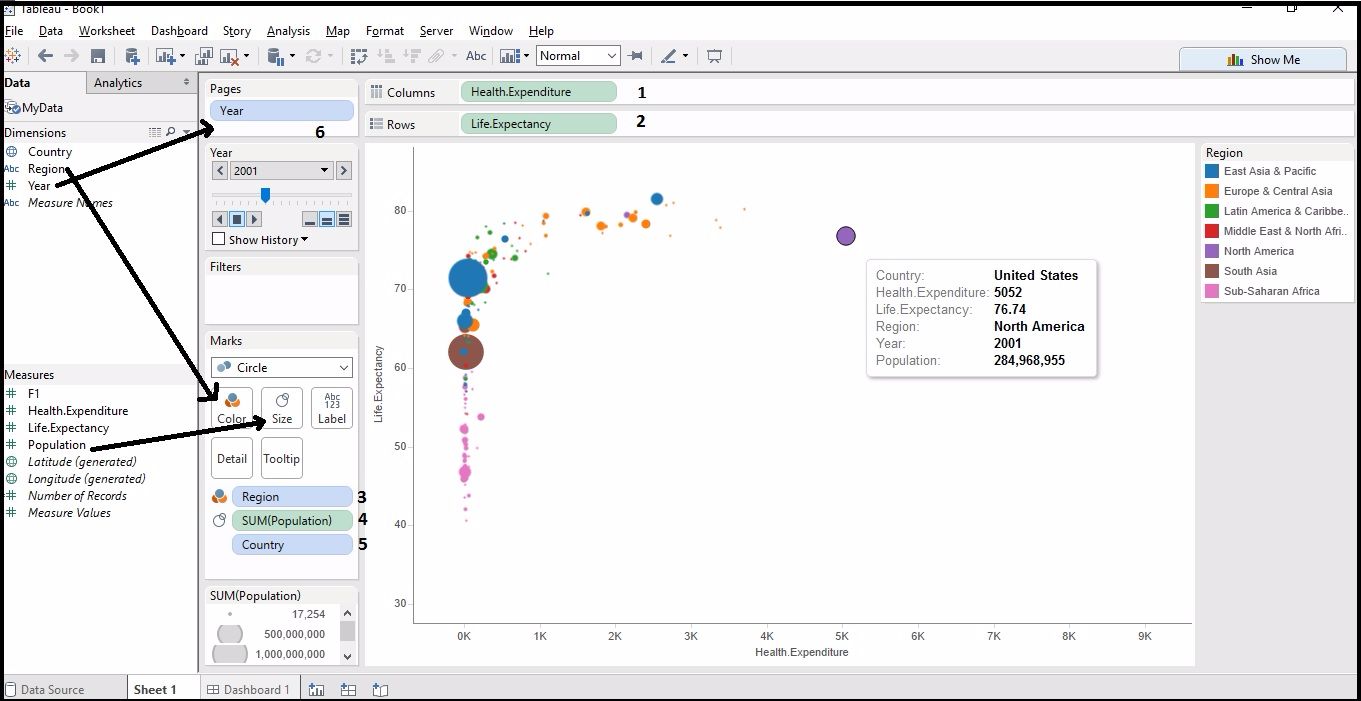
Step 1. Place Health Expenditure in columns shelf
Step 2. Place Life Expectancy in rows shelf
Step 3. Place Region in color from marks card
Step 4. Place Population in Size from marks card.
Step 5. Place Country in the marks card (for tool tip)
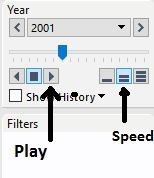
Step 6. Put year in Pages card (for animation) and that’s done.
Using pages we can use some animation in the Tableau sheet/dashboard.
Download Workbook here!
Download Data file here!
Dear Author,
It’s good to see the animated chart in tableau desktop but will this work the same way in server? I tried in my work but there is no workaround in tableau server.Please let me know if you found something to make the play option enabled in server.
Hi Dinesh,
Thanks for the comment. Sorry but the pages card does not work Online/Server.