
How to create Manual Legends in Tableau
Today we’ll be learning, how to create manual or custom legends in Tableau. This tutorial will be helpful to save lot of dashboard space.
Creating a basic chart
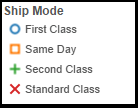
We’ll be creating a simple chart as the first step. So create a simple chart as shown in the image below and place ‘Ship Mode’ to shape and colors (as shown). Then you’ll see two legends one color legend and one shape legend. As of now Tableau doesn’t have any option for a single color+shape legend. In this tutorial we’ll be merging both of the legends. We’ll be calling it Chart Sheet.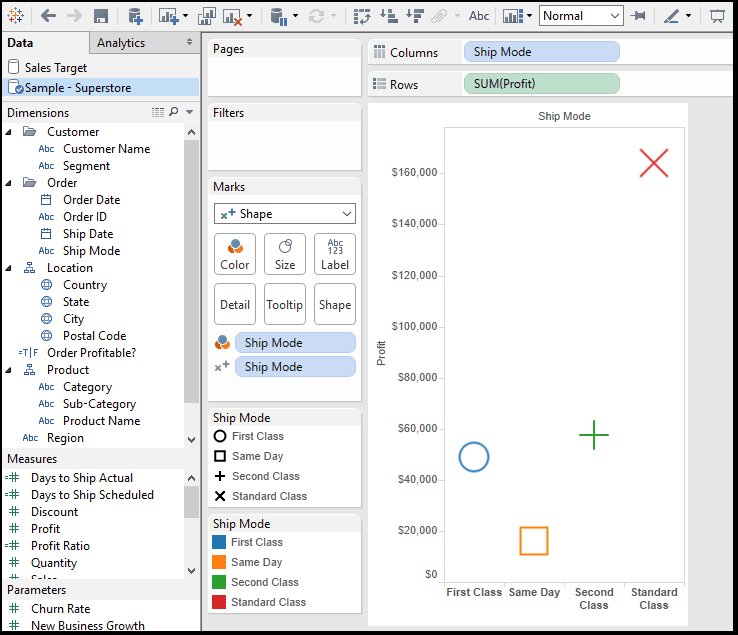
Chart for legend
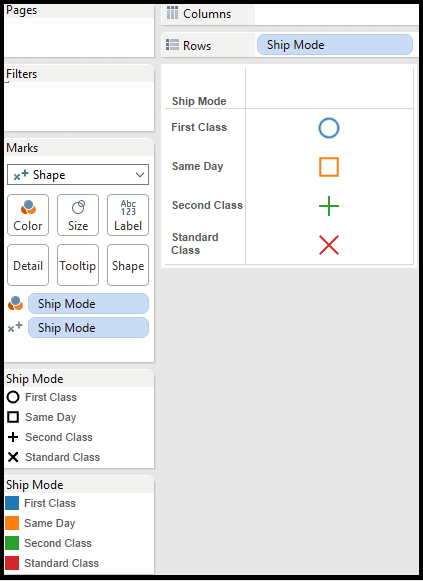
Now duplicate the already created sheet and remove Profit from rows shelf and place Ship Mode to the rows shelf. You’ll get the chart as shown in the image below. We’ll be calling it Legend Sheet.
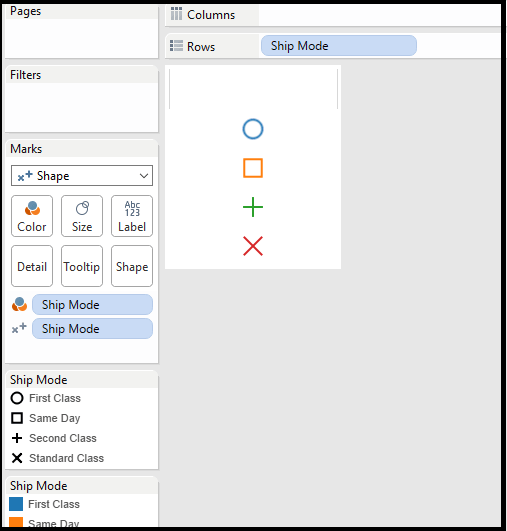
After some cleaning after removing the header and cleaning the sheet like removing axis,ticks etc.,the dashboard will look like this-
Creating final dashboard
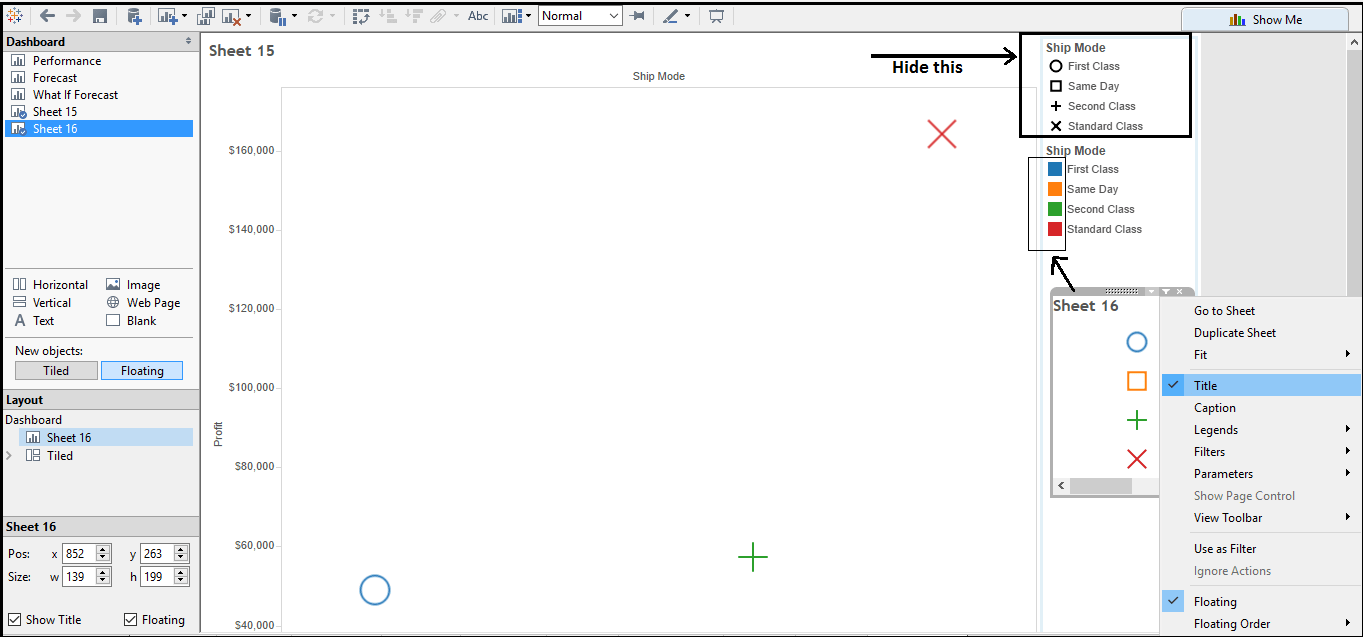
Add the Chart Sheet to dashboard and Legend sheet as floating as shown in the image below and hide the title of the Legend sheet and place it over the colored boxes of the legend as shown in the image. Adjust the size of legend sheet properly to fit over colored legend.
After doing the steps perfectly we’ll get the Manual legend as-
Thanks for reading! It was very simple tutorial on how to create Manual legends in Tableau. Comment your doubts and suggestions!
Nice workaround. Let’s hope the developers incorporate color coded symbol legends into the product. It would be a nice add.