
Rank Chart in Tableau
Today we’ll be learning how to create Rank chart in Tableau. Rank chart is very effective way to show the ranking of the dimension variation across the year,category or any other dimension. The Rank chart is easy to create and very useful.
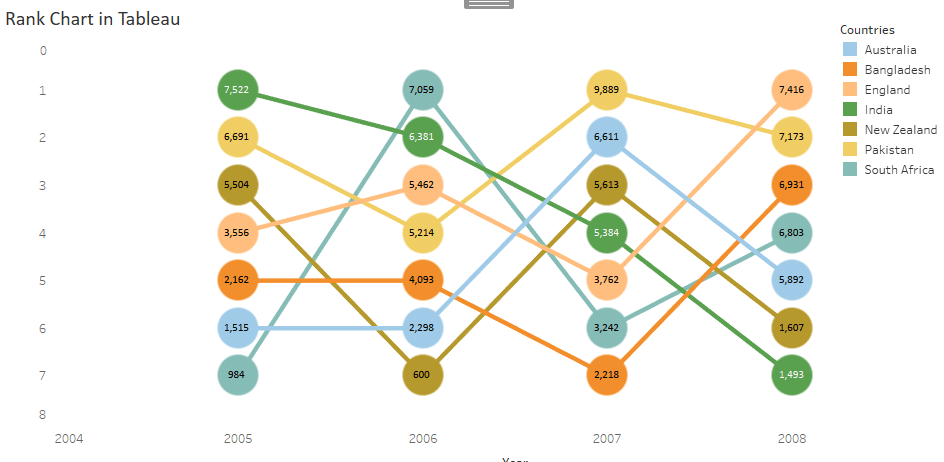
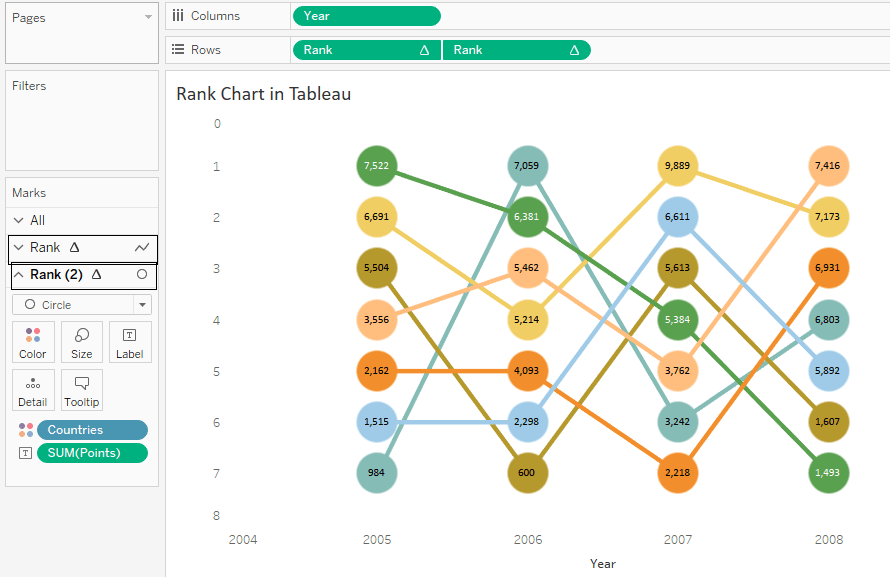
Once you follow the steps you’ll get the Rank chart something like this:
For this tutorial I created sample dataset and the data has 3 columns Country, Points and Year as shown below. There is no meaning of points I just used a RAND() function in Excel and created the dataset.
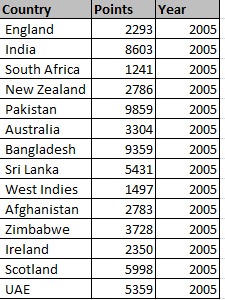
Data
For the first step create a calculate field. I named it ‘Rank’ with the following calculation:
RANK(SUM([Points]))
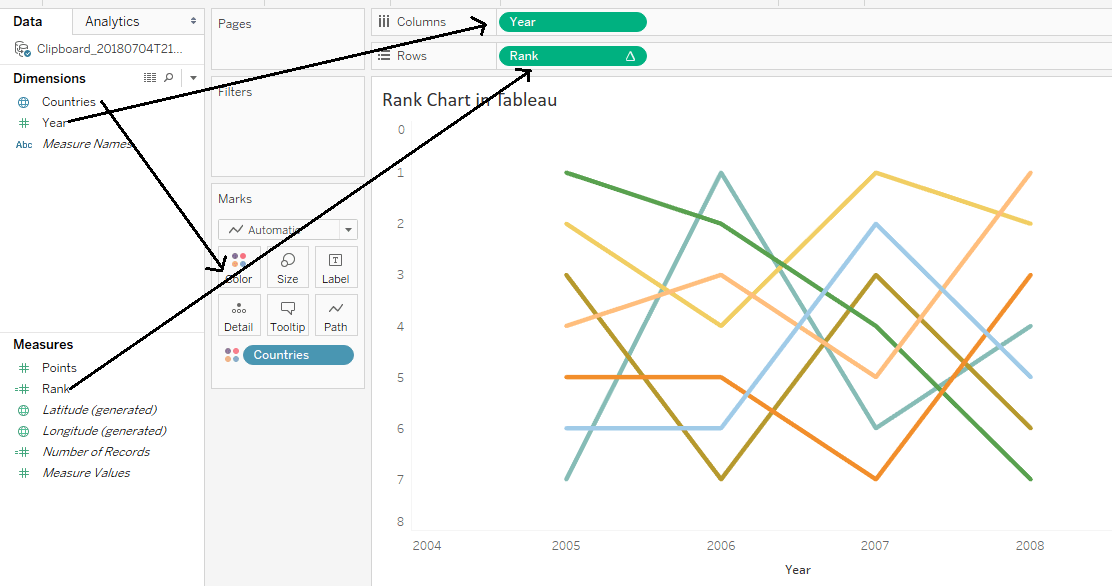
Now put Year to Columns shelf and calculated field Rank to Rows shelf and Country to Color card as shown below.
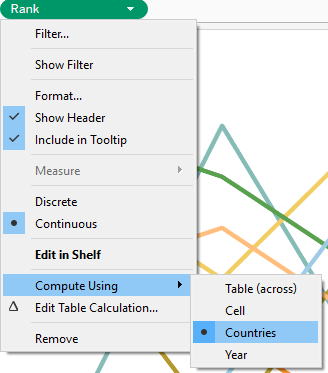
Now click on Rank and compute using Countries.
Now place Rank to Rows shelf and create dual axis chart. Change the chart type to Line and Circle. If you have not created dual axis chart before check out here to dual axis
chart.
Make the basic formatting changes according to your need and done!

Click on the image for interactive dataviz.
Thanks for reading! Comment your suggestions or queries.
Keep visiting Analytics Tuts for more tutorials.
I have read this article and graphic and get some related information thanks
if i wanna make a filter, to show in the time only the first two, how can i make ?
You can add the filter for date/year