
Step Chart in Tableau
Hello friends! Today we’ll see how to create Step chart in Tableau. Step charts are one of the visually appealing line charts. I’ve used superstore data for the tutorial. Easy to follow tutorial
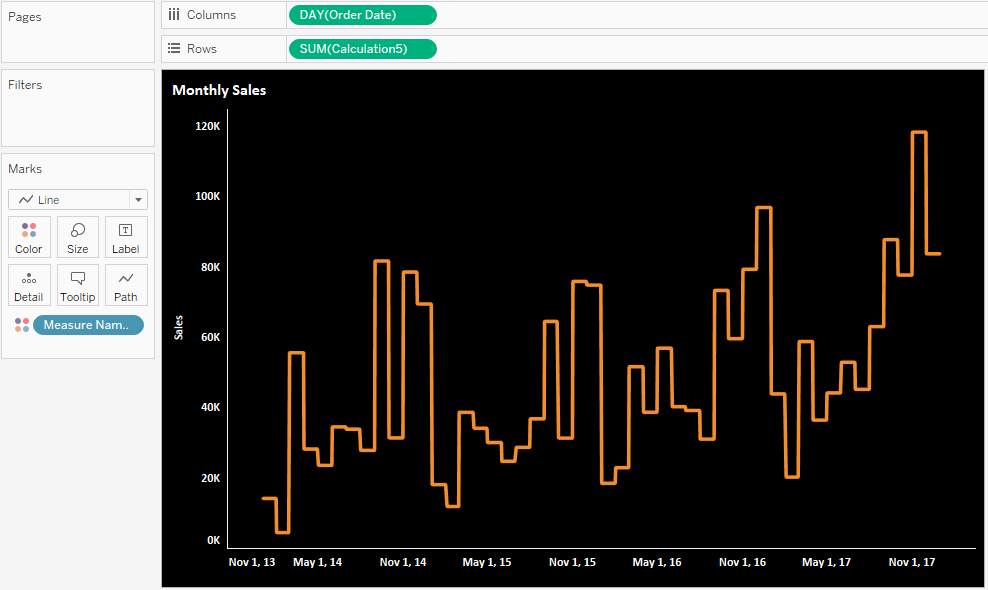
The tutorial is one step tutorial. Create the following Calculated field:
{fixed DATETRUNC('month',[Order Date]):SUM([Sales])}
What this calculated field will calculate the total sales for that date keeping the month fixed. Now place order date in columns and the calculated field to rows shelf and done.
Check interactive dashboard here: Step Chart in Tableau
Keep visiting Analytics Tuts for more tutorials.
Thanks for reading! Comment your suggestions and queries.