
Tableau: Waterfall Chart in Percentage
Today we’ll be learning to create waterfall chart in Tableau. In my earlier post Waterfall Chart in Tableau but it was in the numbers but not in percentage. Workbook is attached to download. I’ll be using superstore data for the tutorial.
Step 1. Creating calculated fields
In the first step we’ll create all the calculated field required for the chart.
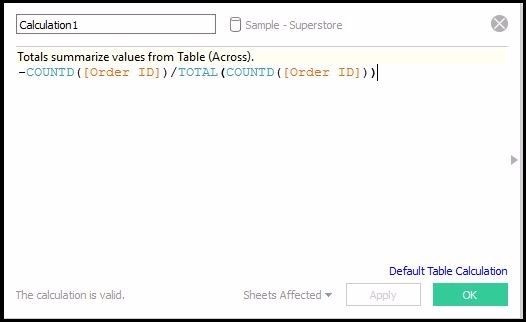
Calculation 1- This calculation will return the fraction of orders for the particular dimension (like what is the fraction of orders with ship mode as Same day). You will get to know more about this calculation in coming steps.
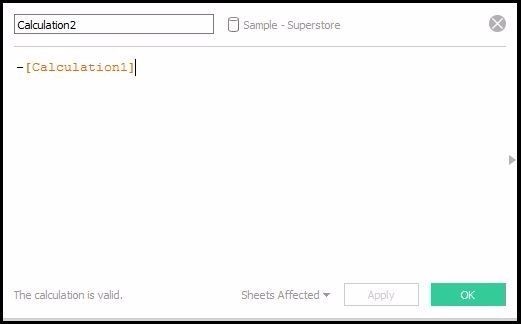
Calculation 2- This calculation will return positive values of Calculation 1 values.
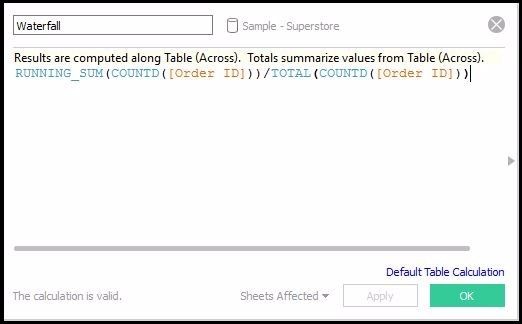
Waterfall– This calculation will return the running sum of the calculation 1.
Step 2. Creating waterfall chart
In this step we’ll be creating final chart.
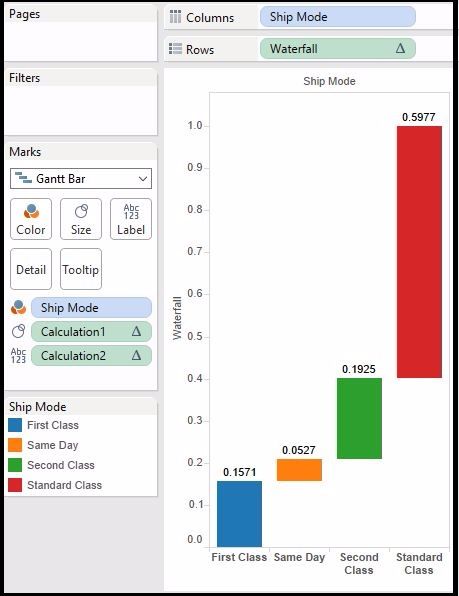
Place Ship mode in columns shelf and Waterfall (Calculated field) to rows shelf and select chart as Gantt Bar chart.
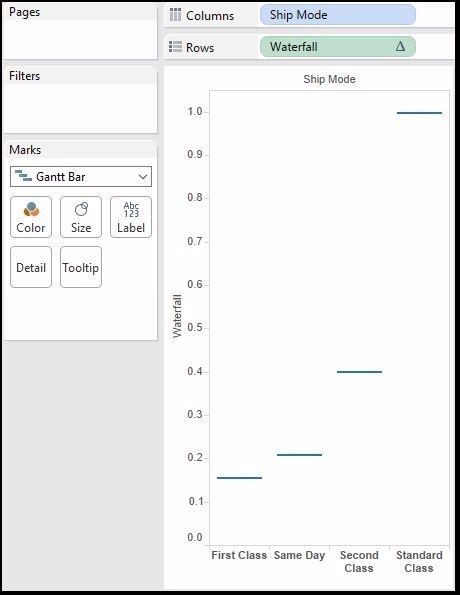
Now put ‘Ship mode’ to color,’Calculation 1′ to size and ‘Calculation 2’ to Label in Marks card and the chart is done.
Formatting Axis and Labels
Axis
In this step we’ll change the Y axis to percentage.
Right click on the Y-axis and click format as shown in the image below. In the left panel a format window will appear now go to axis> Numbers > Percentage and set Decimal places as 0.
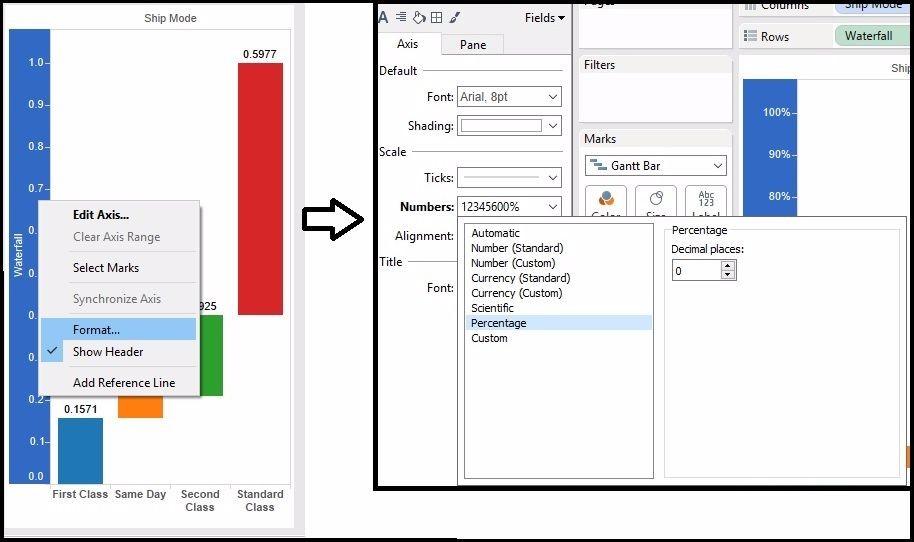
and the axis is done, now it will be in percentage.
Labels
Now click on the Calculation 2 from the marks card then click on format as shown in the image below. Now go to Pane > Numbers (in default) and set the decimal places as 2.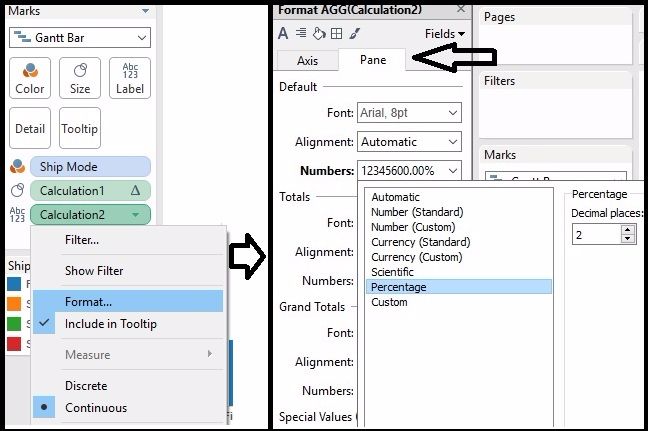
Now the labels are done, they will in the percentage.
So that’s done for the waterfall chart. It was bit different than earlier method but a easy one.
Download the Workbook here!
This blog is very useful, but if we select top 3 Ship Mode then on Y axis % is not changing, it is taking 100%, if i select top 3 it will adjust order Id count according to RUNNING_SUM, if there is any way to adjust the percentage.
Waiting for your reply.
Please share more details.