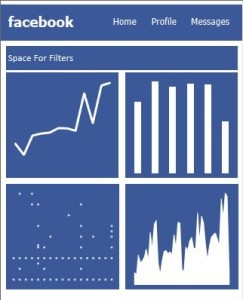
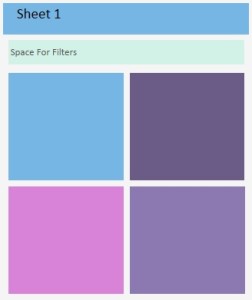
Social Media Dashboard Mobile Template for Tableau
 Due to high demand I have created a Social Media Mobile Template Dashboard. I have made the Charts and Dashboard very fast so I have not used action filters in the dashboard. Download, Share and Reuse the Template according to your need.

